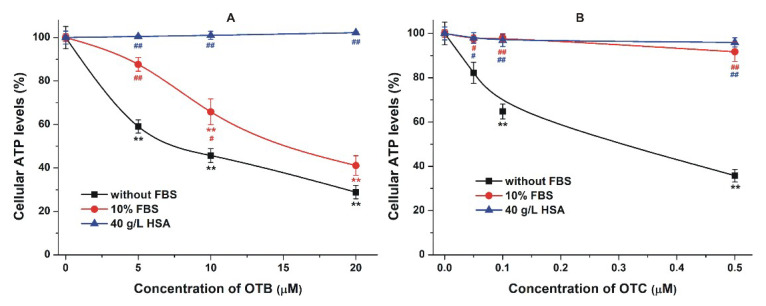
Figure 10.
Effects of ochratoxin B (OTB; (A)) and ochratoxin C (OTC; (B)) on adenosine triphosphate (ATP) levels/well (% of control). HepG2 cells were incubated for 48 h in the absence and presence of 10% fetal bovine serum (FBS) or 40 g/L human serum albumin (HSA; statistical significance compared to the corresponding control: ** p < 0.01; compared to the effect without albumin: # p < 0.05, ## p < 0.01).

