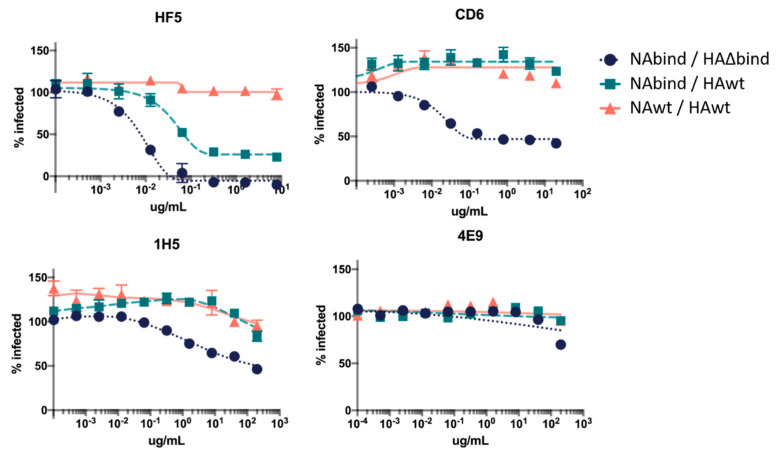
Figure 2.
Neutralization of viruses with different dependencies on HA and NA for receptor binding by anti-NA antibodies in single-cycle infection assays. Neutralization curves show the percentage of the NAwt/HAwt, NAbind/HAwt, or NAbind/HA∆bind virus infection that is inhibited by each antibody over a range of concentrations compared to the no-antibody control infection. Points represent the mean of three technical replicates with error bars showing the standard error of the mean.

