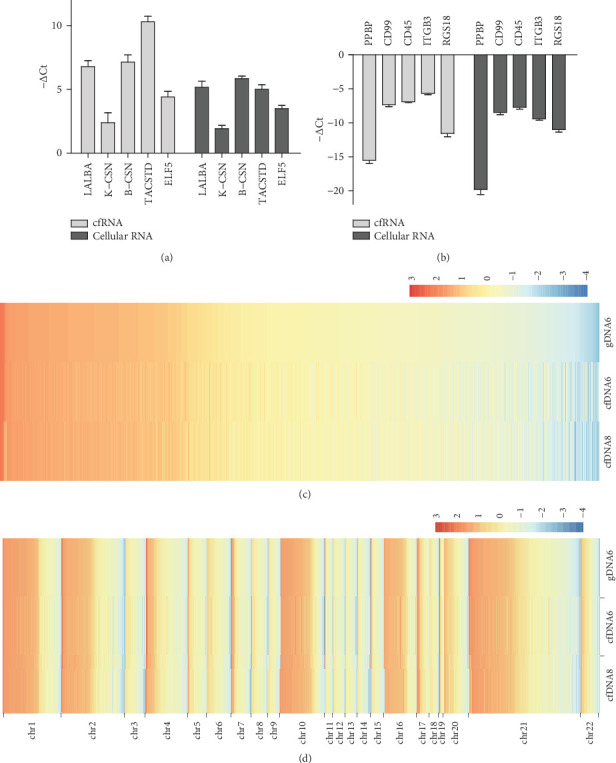
Figure 2.

Identification of BM cfRNA deriving mainly from breast-derived cells. RNAs of BM cfRNAs and BM cellular RNA from three different donors (donors 7, 8, and 9) were subjected to RT-PCR to detect mRNA levels of (a) highly expressed genes in breast-related and (b) highly expressed genes in blood-related cells. The graphs show normalized −ΔCt values for the indicated genes (described in detail in Supplemental Text). All error bars denote SEM, n = 3. (c) The heat map of methylation levels in every identical reliable slide window of different samples. WGBS data was analyzed with default parameters (1000 bp slide windows, 500 bp overlap). For accuracy, only slide windows with more than 3000 total C reads (methylated and unmethylated) were regarded as reliable for comparison between samples. The graph was drawn with Log2 methylated percentages after mean subtraction and standardization and arranged in descending order across all chromosomes of the gDNA6 sample. (d) The chromosome-separated heat map of methylation levels in identical reliable slide windows of different samples. The graph was drawn with Log2 methylated percentages after mean subtraction and standardization and arranged in descending order in each chromosome of the gDNA6 sample.
