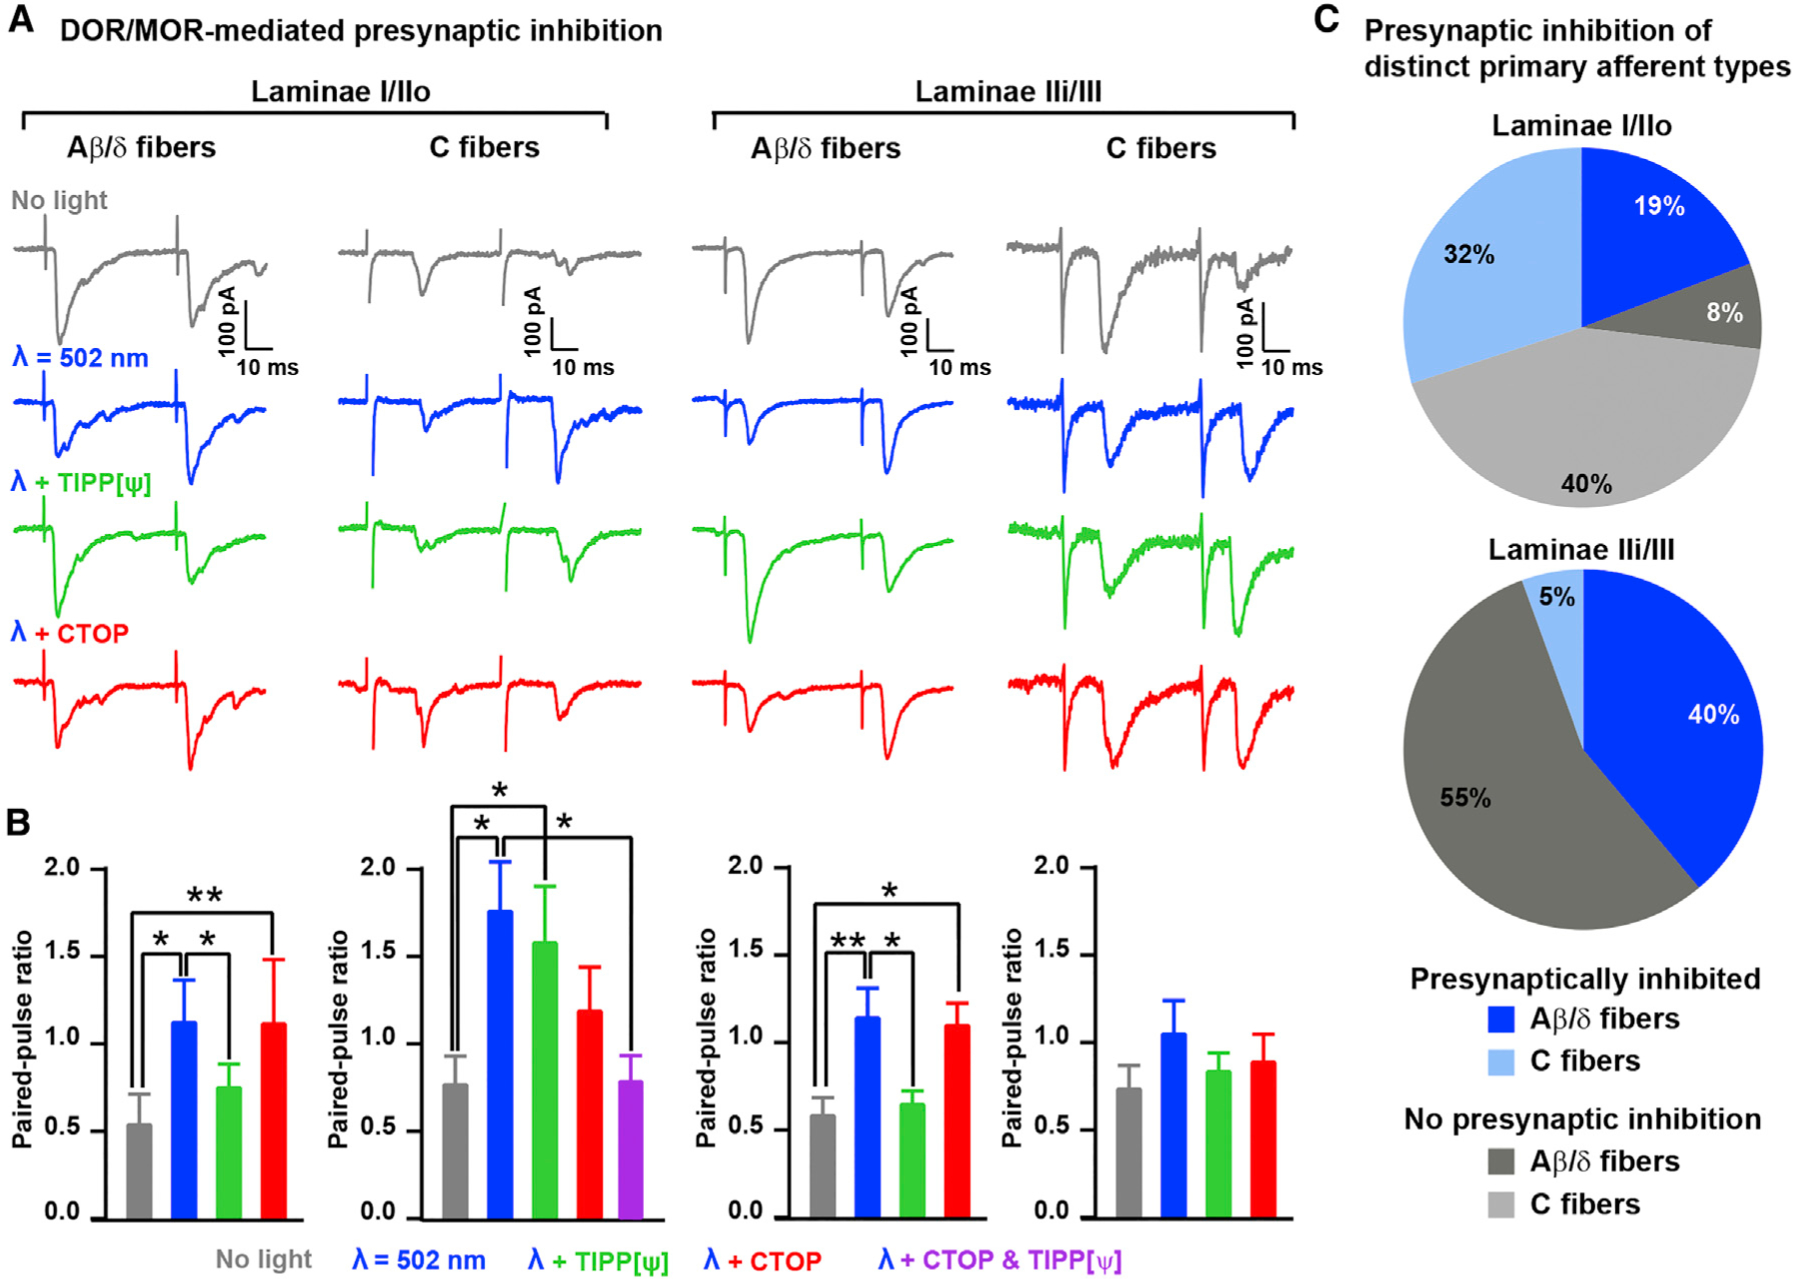
Figure 6. Laminar Organization and DOR/MOR Contribution to Enkephalinergic Presynaptic Inhibition of C- and A-fibers.

(A) Example traces showing that the MOR antagonist CTOP (1 μM) reversed the light-induced enkephalinergic presynaptic inhibition of C fibers in lamina I/IIo, whereas the DOR antagonist Tipp-psi (1 μM) reversed presynaptic inhibition of A-fibers in lamina IIi/III.
(B) Quantification of (A) indicating the effect of CTOP and Tipp-psi on the light-induced increase in PPR 1,000 ms after light stimulation (Kruskal-Wallis test, *p < 0.05; **p < 0.01).
(C) Pie charts indicating the proportions of neurons in which light induced a significant increase in PPR (i.e., presynaptically inhibited) in laminae I/IIo and IIi/III and for C- and A-fibers (n = 26 neurons for lamina I/IIo and 18 for lamina IIi/III).
All bar graphs represent mean ± SEM.
