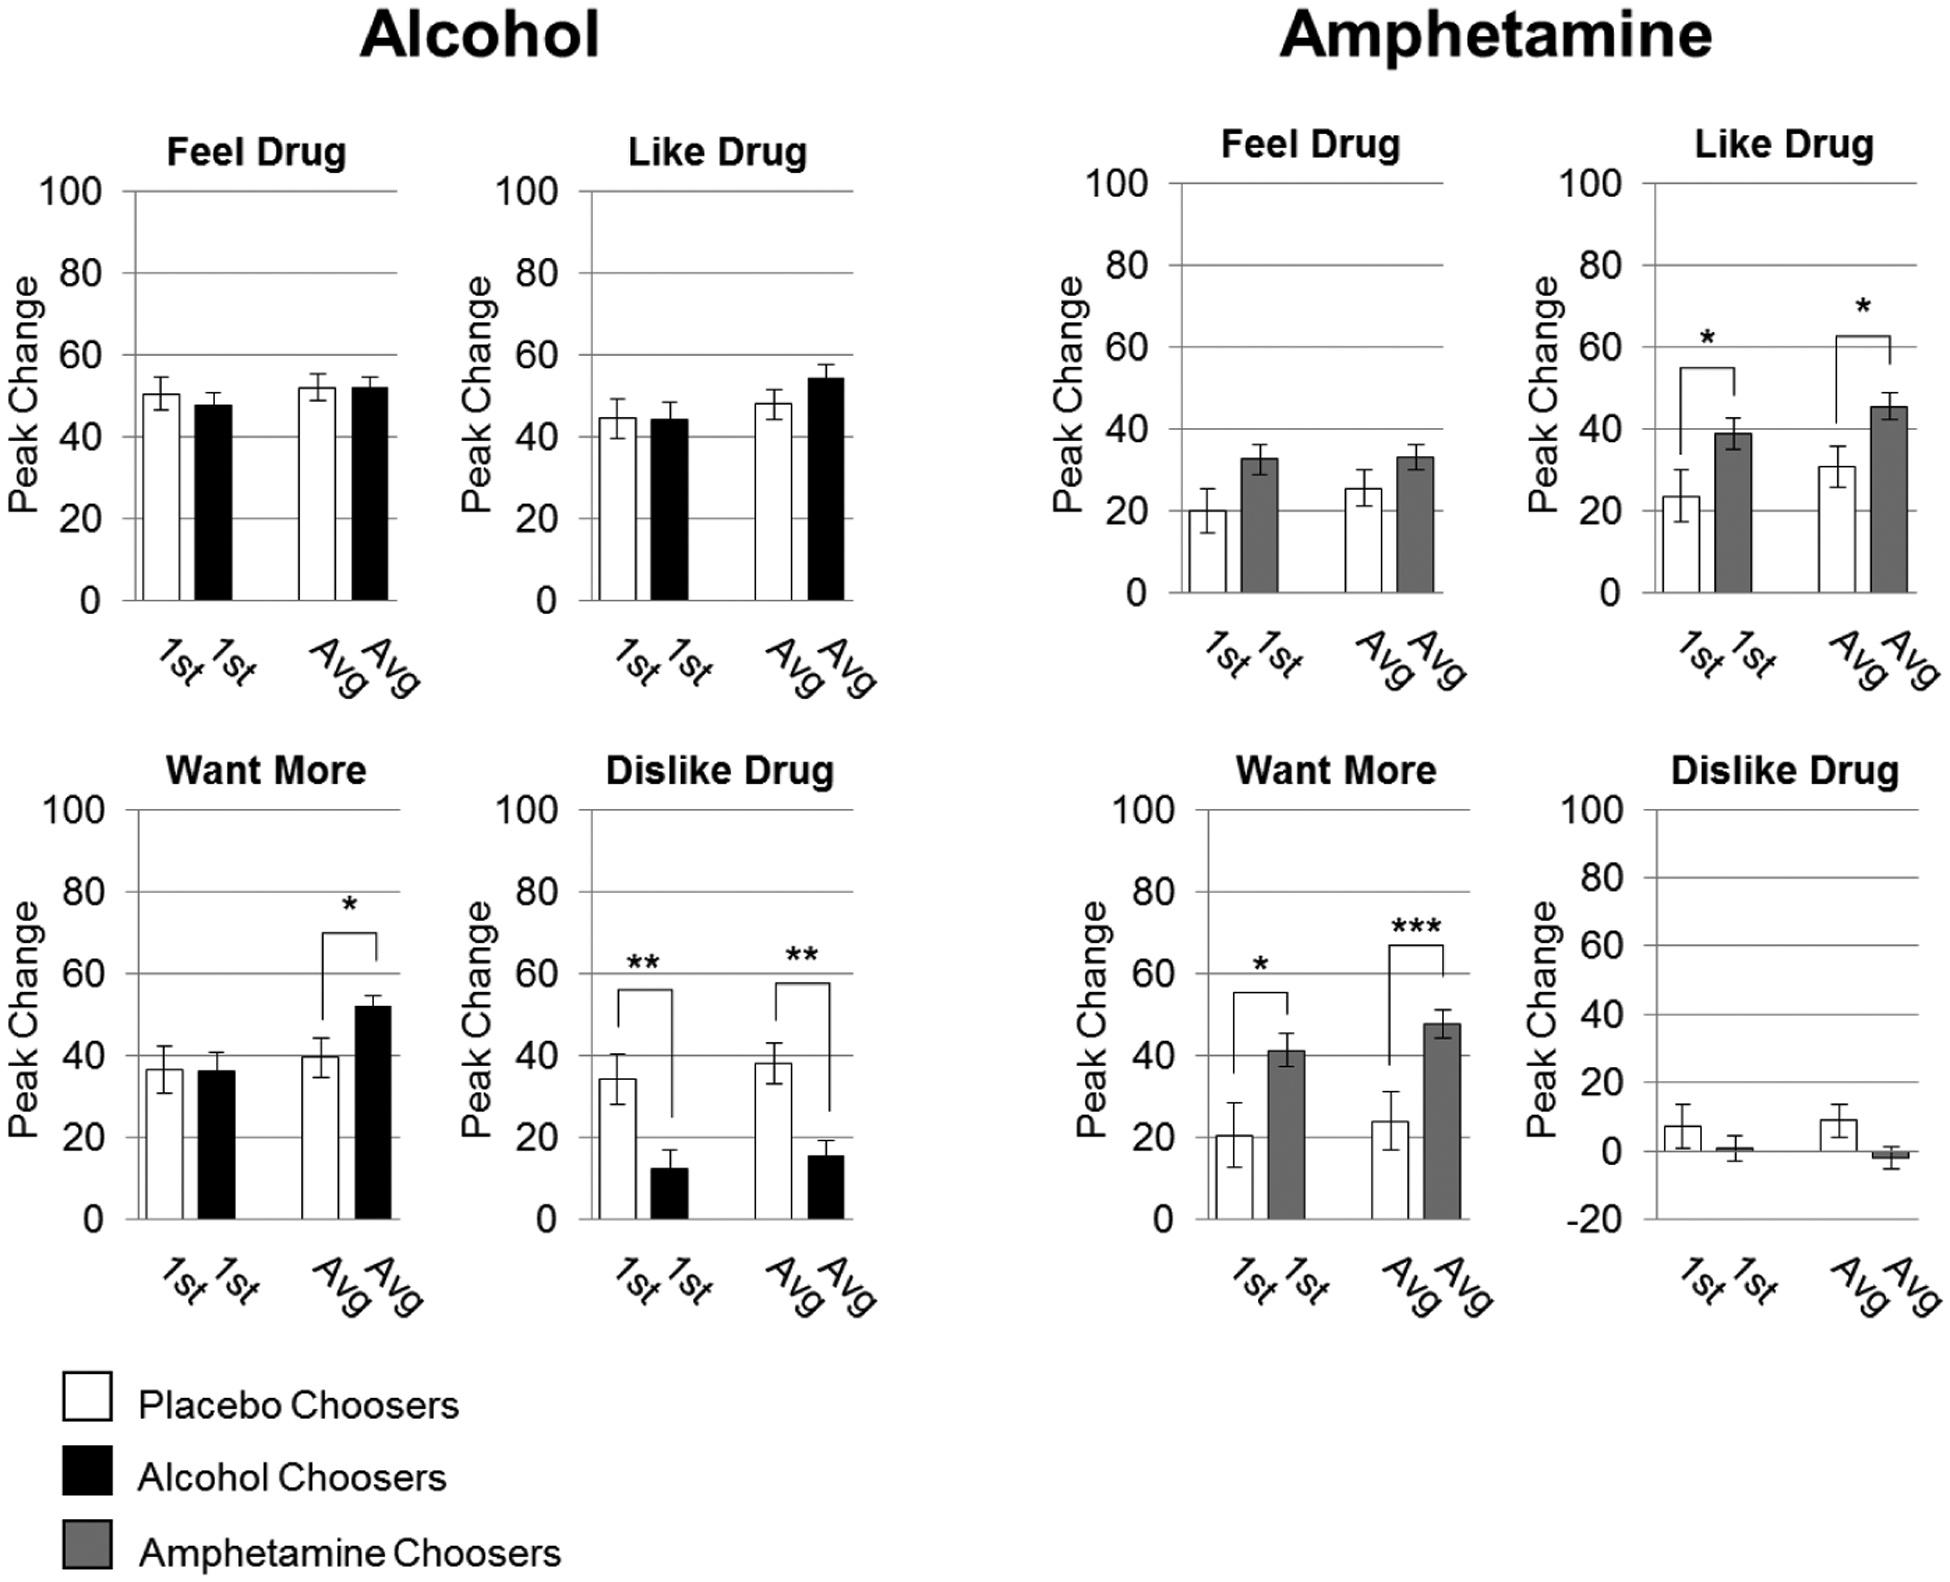
Figure 3.

DEQ responses in relation to choice between Pair 1 and Pairs 1 and 2 combined. Data are expressed as mean (drug-minus-placebo peak change from baseline) ± SEM (n=55,40 alcohol and placebo choosers respectively, n=81,31 amphetamine and placebo choosers respectively; unpaired t-tests; *p<0.05; **p<0.01; ***p<0.001).
