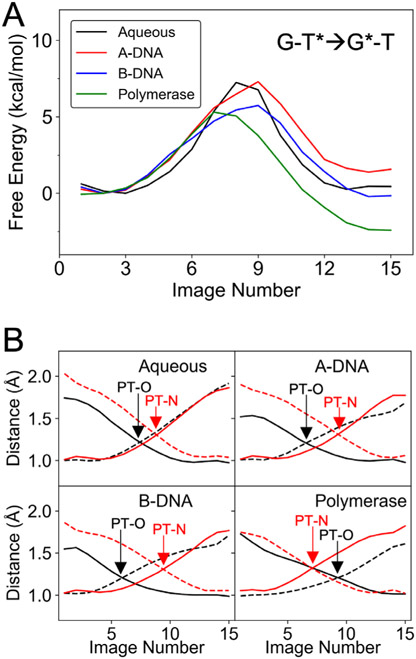
Figure 7.
(A) Free energy profiles along the MFEPs computed from the strings corresponding to the G-T*→G*-T tautomerization for the four systems investigated. The images correspond to equally spaced points along the MFEP. (B) The key reaction coordinates associated with the G-T*→G*-T tautomerization along the MFEP, where R2, R3, R5, and R6 are represented by black solid, black dashed, red solid, and red dashed curves, respectively. Note that R2 and R3 are associated with PT-O (i.e., proton transfer between the two oxygen atoms), and R5 and R6 are associated with PT-N (i.e., proton transfer between the two nitrogen atoms).

