
Figure 4.
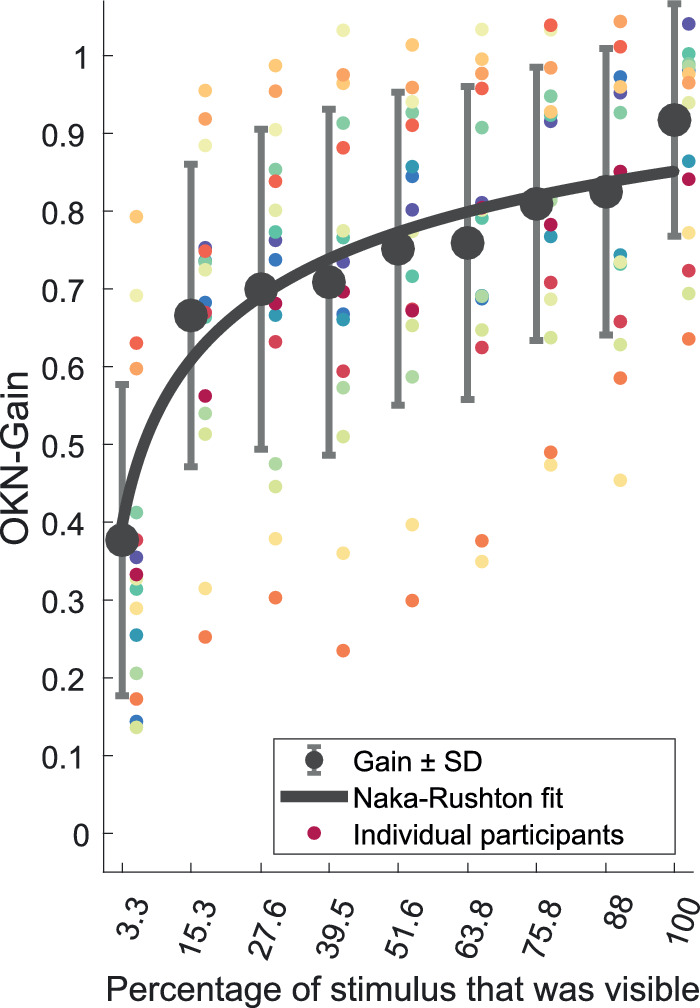
Results averaged across participants; OKN gain increases with the extent of the peripheral visual field that is stimulated. Small colored dots are the mean gain (across 8 trials) for each participant (Note that the color coding of each individual participant is consistent with Fig. 3). Large gray circles are the mean gain across participants. Mean values have been fit with a Naka-Ruston fit (solid black line). Error bars are ±1SD.