Figure 1.
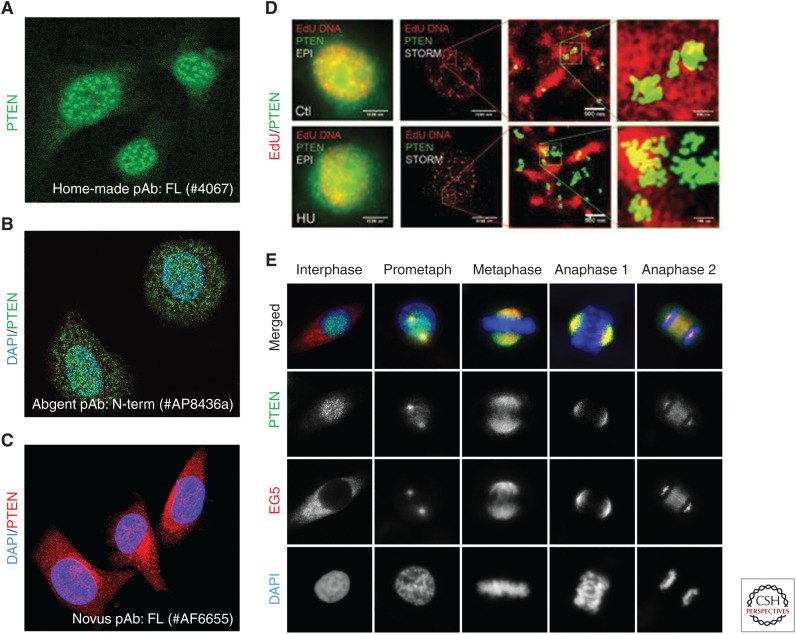
Diverse patterns of PTEN localization. (A) Predominant nuclear localization of PTEN as punctate centromere-like foci (mouse embryonic fibroblast cells, unpubl. data), shown by immunofluorescence of PTEN using a home-made rabbit polyclonal antibody against full-length PTEN (#6047, antibody reported in Shen et al. 2007). (B) PTEN in both the nucleus and the cytoplasm (MCF-7 cells), shown by confocal immunofluorescent analysis using a rabbit polyclonal antibody against an amino-terminal region of PTEN (#AP8436a). (Panel B reprinted, with permission, from Abgent © 2019.) For more information, see www.abgent.com/products/AP8436a-PTEN-Antibody-N-term. (C) PTEN in both the cytoplasm and the nucleus (Neuro-2A mouse neuroblastoma cells), shown by immunofluorescence of PTEN using a goat polyclonal antibody against full-length PTEN (#AF6655). (Panel C reprinted, with permission, from Novus Biologicals.) For more information, see www.novusbio.com/products/pten-antibody_af6655. (D) Colocalization of DNA replication sites (red) and PTEN (green) with or without hydroxyurea (HU) treatment (HCT116 cells), shown by stochastic optical reconstruction microscopy (STORM). (Panel D reprinted from Wang et al. 2015, with permission, from Nature Publishing © 2015.) (E) Colocalization between PTEN and EG5 during mitosis (HeLa cells), shown by confocal immunofluorescence using the rabbit anti-PTEN polyclonal antibody (#6067, as in A, green) in overlay with EG5 (red). DNA was counterstained with DAPI. (Panel E reprinted from He et al. 2016, with permission, from Nature Publishing © 2016.)

