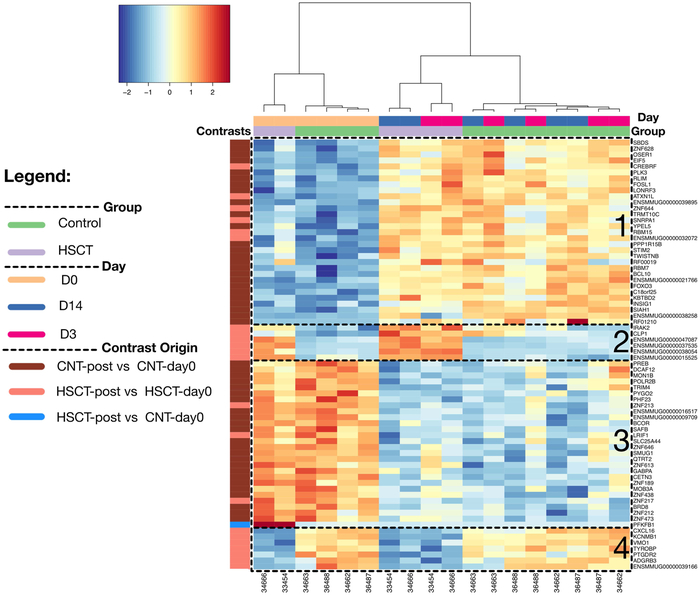
Figure 6: HSCT and control macaques experience similar changes in gene expression after YFV 17D vaccination.
A heatmap of differentially expressed genes (rows) and samples (columns) demonstrating the identified 72-gene transcriptomic signature on the rlog-transformed expression matrix; pair-wise hierarchical clustering with Ward.D2 using Euclidean distances. There are 2 experimental groups (HSCT vs. controls), collected at 3 timepoints: day 0, 3, and 14, which are labeled according to the colors in the legend. The genes are obtained by identifying the overlap of 3 contrasts pertaining to the experimental design: A) Control macaques post-vaccination (Days 3 and 14) versus pre-vaccination (Day 0), B) HSCT macaques post-vaccination versus control macaques pre-vaccination (day 0), and C) HSCT macaques post-vaccination (Days 3 and 14) versus pre-vaccination (Day 0). Genes grouped into four clusters based on their expression pattern across groups.

