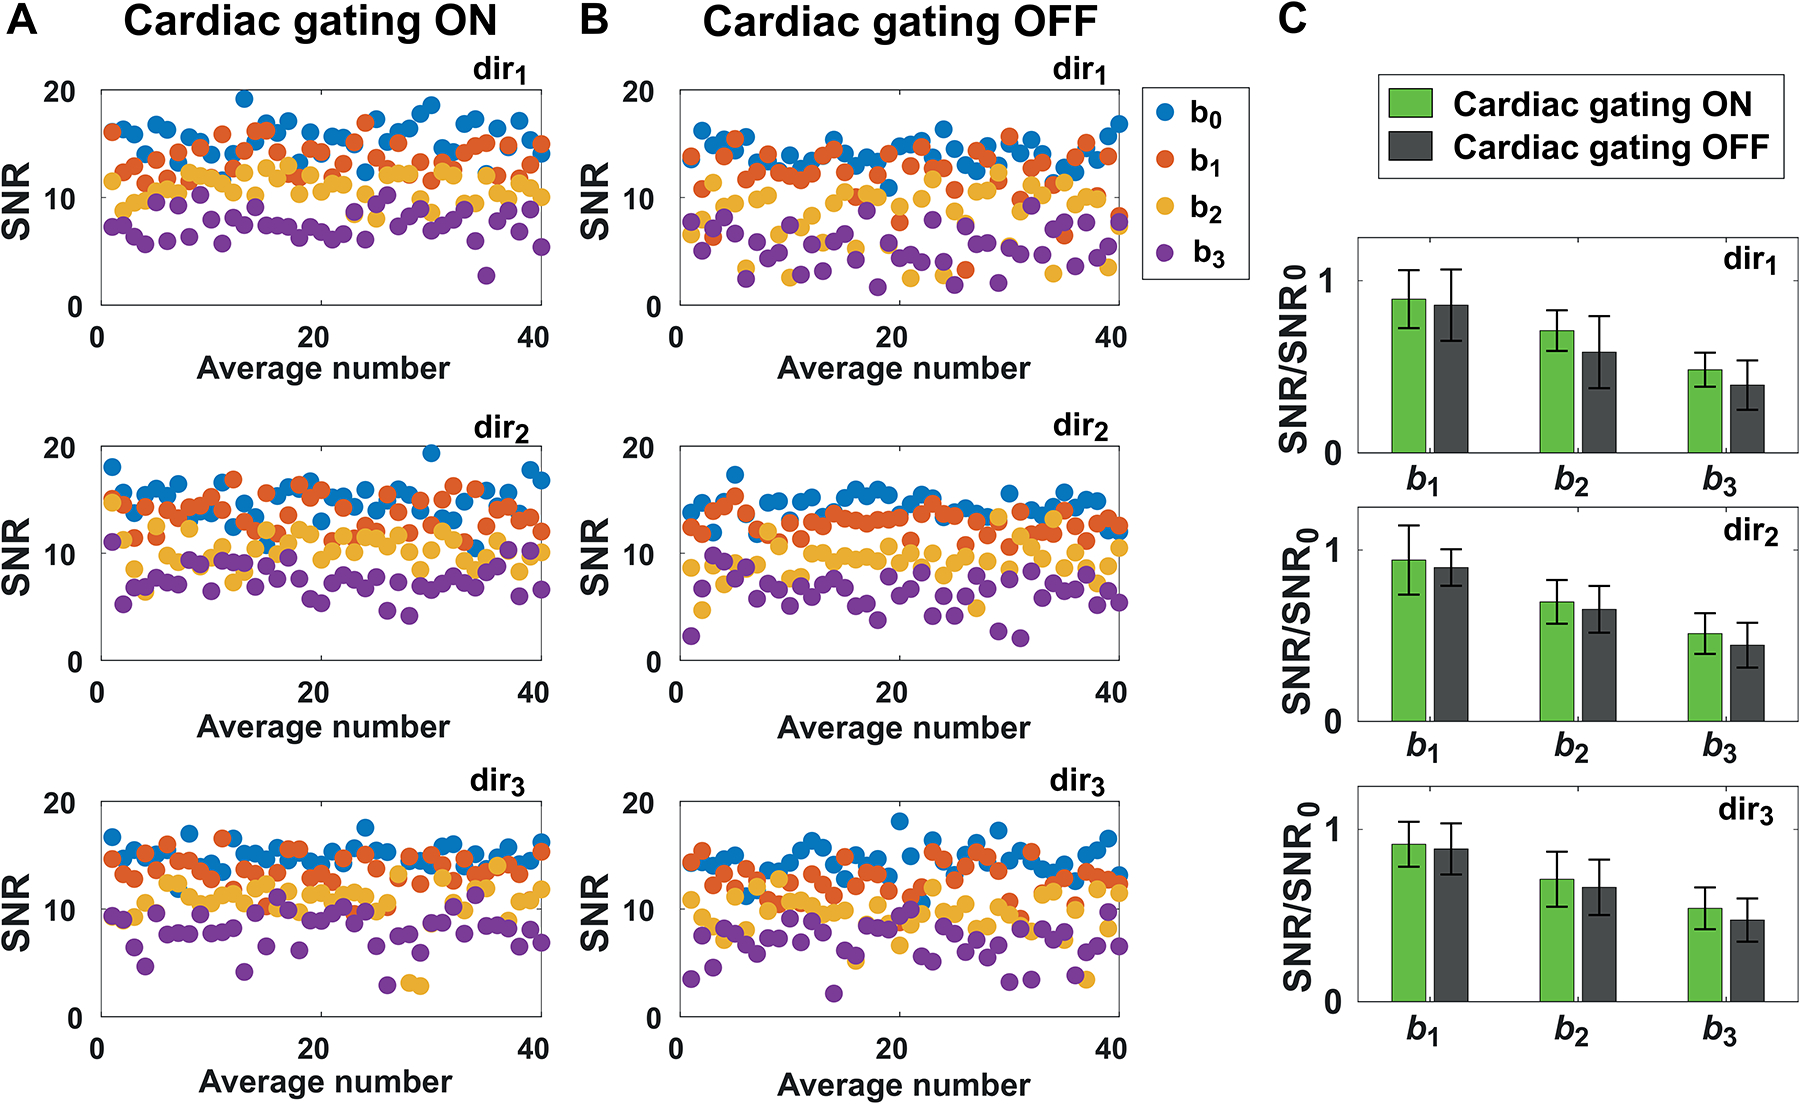
Figure 4: Effect of cardiac gating on tNAA SNR.

tNAA SNR calculated for single averages in one subject at all b-values and diffusion-weighted directions (A) with and (B) without cardiac gating. (C) Comparison of average SNR at different b-values (b1, b2 and b3) and directions (dir1, dir2, dir3) obtained with and without cardiac gating. The reported SNR were normalized to the SNR calculated at b0 (SNR0), in order to remove effects due to fluctuations in TR in the acquisitions with cardiac gating. Error bars represent standard deviations.
