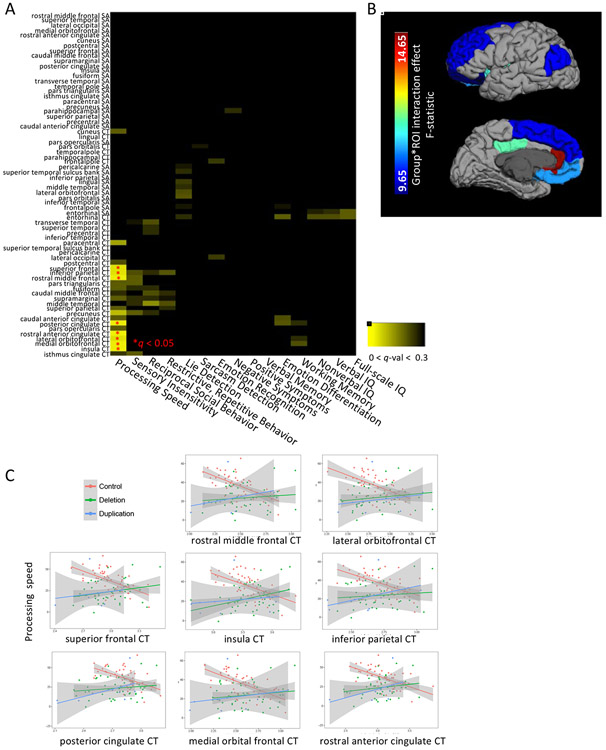
Figure 3: Regional cortical thickness (CT) of frontal, inferior parietal, and medial regions differentially explains processing speed depending on group.
After regressing out age and sex from cognitive measures, a linear model was applied to estimate the interaction effect of brain and group for each of the 15 traits using measures of CT or SA. False discovery rate correction was applied for 34 ROIs,15 traits, and each brain metric (SA or CT). Panel A depicts a heatmap of the q-values for the significance of the interaction term associated with each test, from q = 0 to q = 0.30. Panel B depicts the ROIs for which there was a corrected interaction effect, plotting the associated F-statistic. Panel C displays the within-group correlation between processing speed and CT for each of the 8 regions that showed a significant interaction effect. The control group showed a consistent negative correlation between CT and processing speed that was not found in either CNV group.

