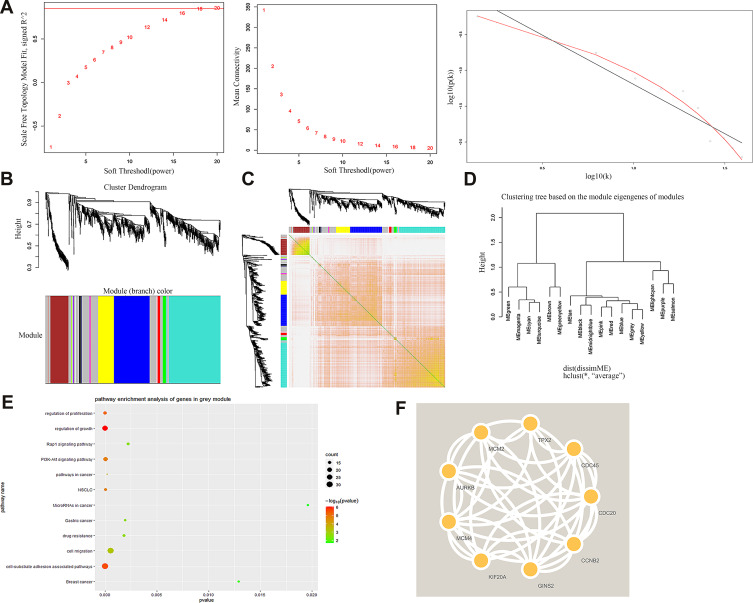
Figure 2.
WGCNA co-expression network analysis of GSE32863. (A) Scale independence, mean connectivity and scale-free topology. (B) Cluster dendrogram of all up-regulated genes. (C) interaction relationship of co-expression genes. (D) Clustering tree based on the module eigengenes of modules. (E) KEGG analysis of genes in grey module. (F) PPI analysis of top nine up-regulated genes.

