Fig. 5.
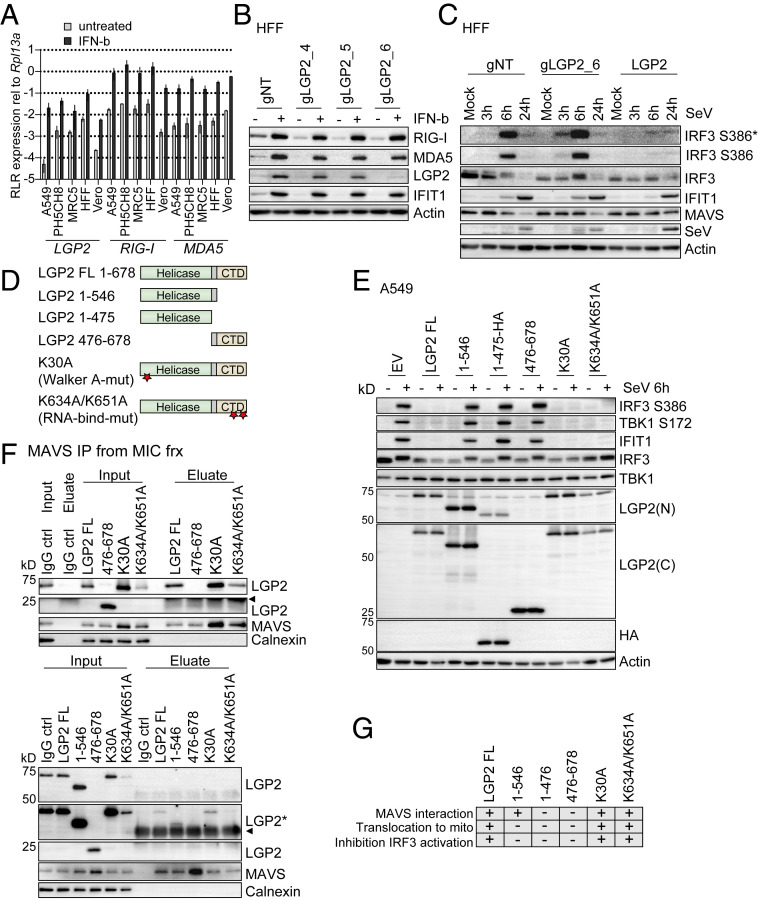
LGP2 is a negative feedback regulator of RIG-I signaling. (A) SYBR green qPCR analysis of RLR expression levels in various cell lines. The indicated cell lines were left untreated or treated with 500 IU/mL IFN-β for 8 h. cDNA was subjected to qPCR analysis using primer pairs specific for LGP2, RIG-I, or MDA5. Data were normalized to Rpl13a housekeeping gene expression and are derived from two (MRC5, Vero) or three (A549, PH5CH8, HFF hTert) independent experiments measured in triplicate. Presented are mean and SD on a log10 scale. (B) Western blot analysis of CRISPR/Cas9-mediated LGP2 knockout in HFF hTert cells. HFF hTert cells were transduced with different guide RNAs (nontargeting [gNT] or targeting LGP2 [gLGP2_4, gLGP2_5, gLGP2_6]) and treated with 500 IU/mL IFN-β for 24 h to monitor LGP2, RIG-I, and MDA5 protein expression. (C) Western blot analysis of innate immune signaling in HFF hTert cells with LGP2 KO (gLGP2_6), LGP2 expression (LGP2), or nontargeting control cells (gNT). Cells were mock infected or infected with SeV (40 hemagglutinating unit [HAU]/mL) and harvested at the indicated time points. (D) Illustration of LGP2 deletion and point mutants. Stars indicate position of point mutations. (E) A549 cells were transduced with lentiviral particles carrying empty vector (EV) or different LGP2 constructs. Cells were selected for stable expression with Blasticidin. Cells were infected with 40 HAU/mL SeV for 6 h and subjected to Western blot analysis. LGP2(C), antibody directed against the LGP2 C-terminal region; LGP2(N), antibody directed against the LGP2 N-terminal region. Depicted is one representative out of two independent experiments (n = 2). (F) MAVS protein was immunoprecipitated from MIC fractions of subcellular fractionation experiments performed with A549 cells expressing the indicated LGP2 mutants (SI Appendix, Fig. S5). Inputs and eluates were analyzed using antibodies directed against LGP2, MAVS, and Calnexin. A polyclonal IgG antibody incubated with the MIC fraction served as control for unspecific binding. The presented data are each derived from one representative out of two independent experiments (n = 2). Arrowheads indicate signals derived from IgG heavy chain or light chain. (G) Graphic summary of the observations made with wild-type LGP2 and LGP2 mutants. *, An asterisk indicates longer exposure. −, indicates no interaction with MAVS, no translocation to mito, regular IRF3 activation; +, indicates interaction with MAVS, translocation to mito, inhibition of IRF3 activation induced by SeV infection.

