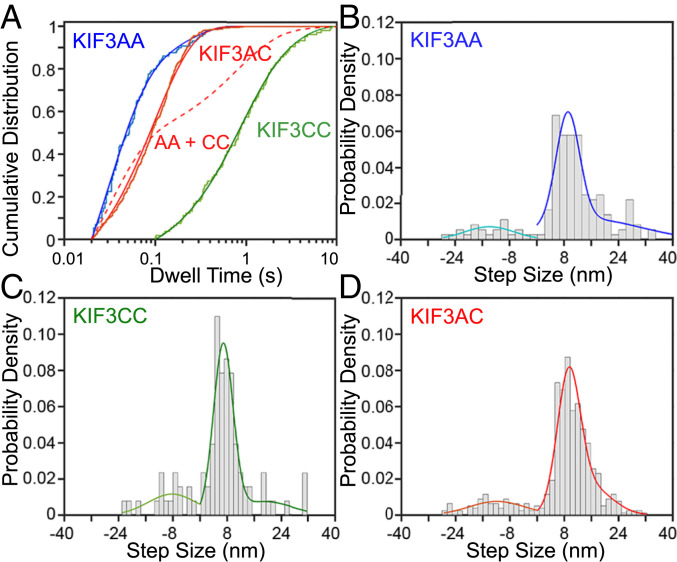
Fig. 2.
KIF3AC steps by a single rate at 1 mM MgATP with 8-nm steps. Step sizes and kinetics measured by iSCAT microscopy for KIF3AC and engineered homodimers. (A) CDF plots and accompanying fits of dwell-time data at 1 mM MgATP for KIF3AA (blue), KIF3AC (red), and KIF3CC (green). Dwell-time data are fit to a single exponential function (KIF3AA) or the sum of two exponential functions as justified by the log-likelihood ratio test (KIF3CC, KIF3AC). Hypothetical curve of the sum of the KIF3AA and KIF3CC fits is plotted (red dashed line). Data are plotted with a logarithmic x axis. (B–D) Histograms of step sizes observed for KIF3AA (B), KIF3CC (C), and KIF3AC (D). Negative step sizes refer to backward steps. Forward and backward step size distributions were fit independently, and fits are shown in different colors. Fit parameters are given in Table 1. For KIF3AA Nsteps = 168, for KIF3CC Nsteps = 93, and for KIF3AC Nsteps = 516.

