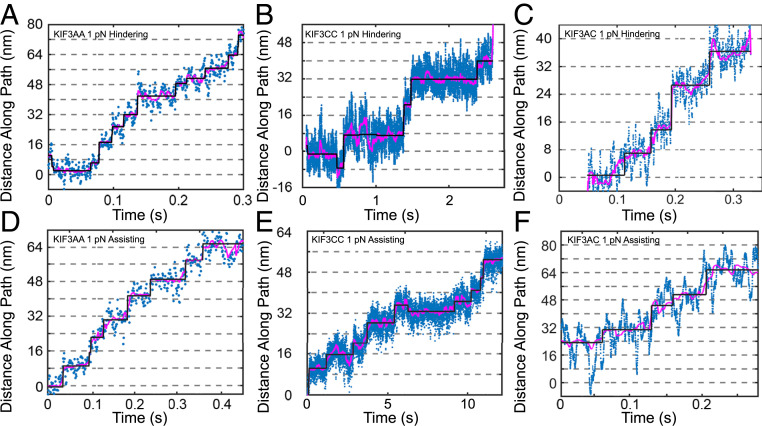
Fig. 4.
Stepping traces with constant assisting and hindering loads. Sample traces of the position of the optical trap as it maintained constant 1-pN hindering force on KIF3AA (A), KIF3CC (B), and KIF3AC (C) and as it maintained constant 1-pN assisting force on KIF3AA (D), KIF3CC(E), and KIF3AC (F). The blue points represent the raw data, the magenta line represents filtered data (Methods) and the black line represents the fit of the Kerssemakers’ algorithm to the data (32).

