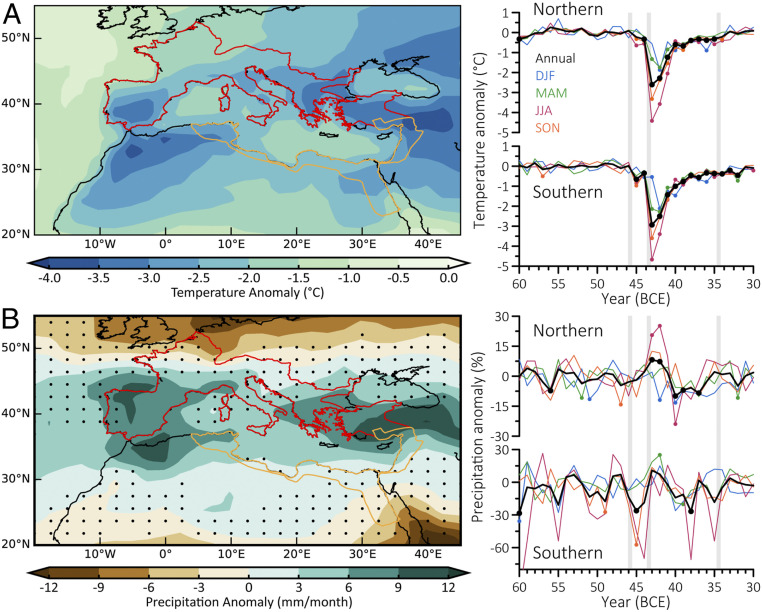
Fig. 4.
Volcanically forced temperature and precipitation anomalies in the Mediterranean region from 60 to 30 BCE. (A) CESM-simulated average annual temperature and (B) precipitation anomalies for 43 and 42 BCE, with outlines of Roman provinces north (red) and south (orange) of the Mediterranean. Dots show areas where annual anomalies are not significant (2σ) relative to the 60 to 46 BCE background variability with no volcanic forcing. Also shown are time series of simulated annual and seasonal temperature and precipitation anomalies for northern and southern Roman provinces. Years with symbols are significant (2σ) relative to the background variability. Gray bars show dates of ice core–based volcanic sulfur injections (32) in the simulations, including the early 43 BCE Okmok II eruption.

