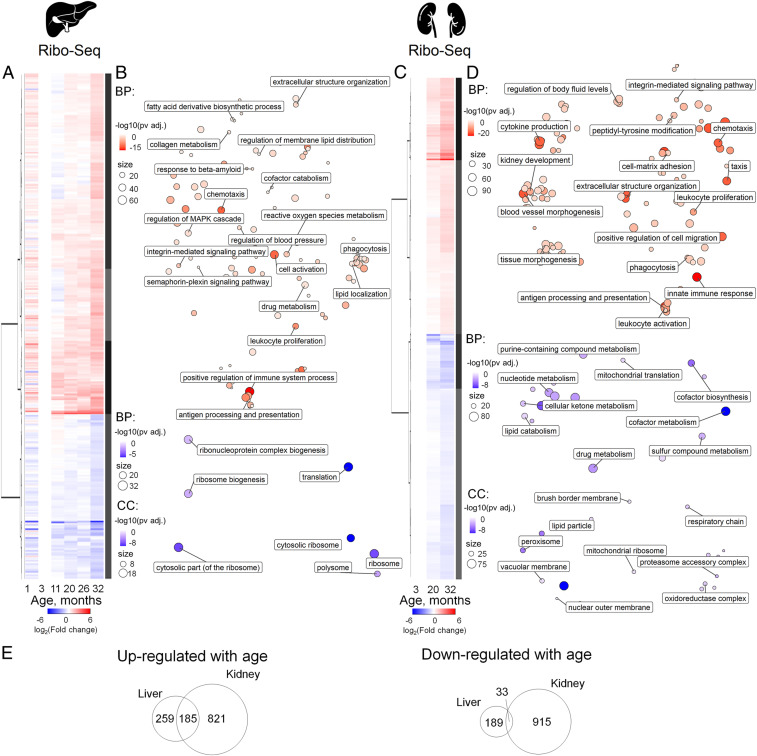
Fig. 2.
Expression profiling of aging mouse liver and kidney by Ribo-seq. (A and C) Heatmap of age-related gene expression changes in liver (A) and kidney (C). For each age, differential expression, in comparison to that of 3-mo-old mice, was calculated. Data from three mice per age were analyzed except for the 32-mo-old samples (two mice). For DE genes with adjusted P value less than 0.05, at least in one age compared to 3 mo old, log2(Fold change) values were clustered and presented on a heatmap (Dataset S2). The number of DE genes is summarized in SI Appendix, Fig. S3. (B and D) GO BP (biological process) and GO CC (cellular compartment) functional enrichment of genes up-regulated (red) or down-regulated (blue) with age in liver (B) and kidney (D) (Dataset S3). (E) Comparison of gene sets differentially expressed in liver and kidney. Venn diagrams show genes up- or down-regulated with age according to Ribo-seq data.

