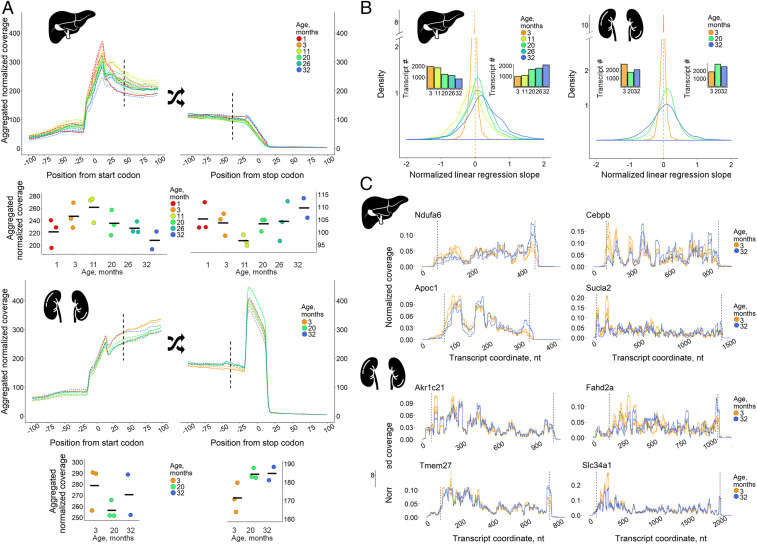
Fig. 5.
Gradual age-related rearrangement of ribosome footprints toward the 3′ end of coding sequence. (A) Metagene profiles of ribosomal coverage in the vicinity of start and stop codons (200-nt windows) of 2,920 and 4,566 transcripts for liver and kidney, respectively. Metagene coverage values at +42-nt position from start codons and at −42-nt position from stop codons are presented on separate graphs below the main graphs (coverage values in replicates, mean shown as horizontal lines). (B) Distribution of linear regression slopes for ribosome footprint profiles normalized to mean coverage at 3 mo and smoothed with the relative transcript coordinate as the predictor variable (SI Appendix, Supplementary Methods, section 5). Bar plots depict the number of transcripts with negative (Left) and positive (Right) slopes. Data from three mice per age were analyzed except for the 32-mo-old samples (two mice). (C) Representative transcripts exhibiting increased ribosome footprint coverage in liver and kidney with age. The dashed lines denote start and stop codons.

