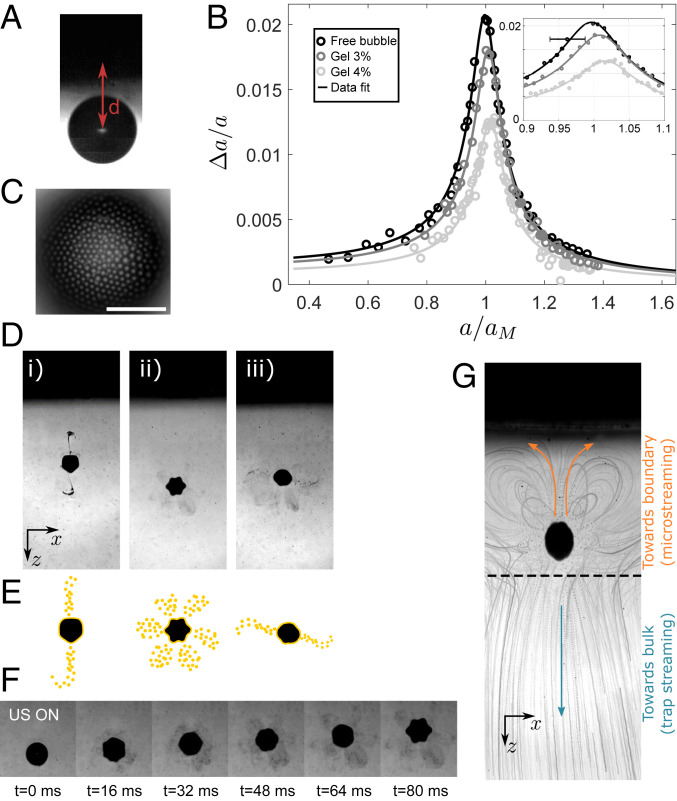
Fig. 4.
In situ bubble dynamics, payload release, and material transport guided by an acoustical trap. (A) Bubble positioned at a distance m from a distant wall. (B) Driving bubble oscillations () with a secondary source of ultrasound (frequency kHz) as a function of bubble radius at rest, . Shown are experimental points (circles) obtained for a “free bubble” far from any boundary (black) and a bubble at a distance from a hydrogel wall with 3% (dark gray) and 4% (light gray) concentration of agarose. Black curves are the best fits to the data. In all curves, the bubble radius is normalized by the theoretical Minnaert resonant size m. (C–F) Particle-coated bubbles as a model for in situ ultrasonic payload delivery. In the micrograph of a particle-coated bubble in C, the bubble interface is covered by m polystyrene particles. (Scale bar, m.) (D and E) Photographs and sketches of observed experimental particle release events. The bubbles are covered with m polystyrene particles. (D, i) Bidirectional release with particle plume toward the adjacent wall (surface mode ). (D, ii) Multidirectional release with six petal-like delivery sites (surface mode ). (D, iii) Bidirectional release with no particle plume toward the adjacent wall (surface mode in transition). (F) Experimental recording of the release event in D, ii during 2,000 acoustic cycles (Movie S5). (G) Subsequent transport of polystyrene particles toward the adjacent wall by bubble-generated microstreaming flows (Upper part of the photograph). Particles are also transported toward the bulk by the millimeter-scale flow generated by the trapping beam itself. (D, F, and G) Approximative bubble radius m.

