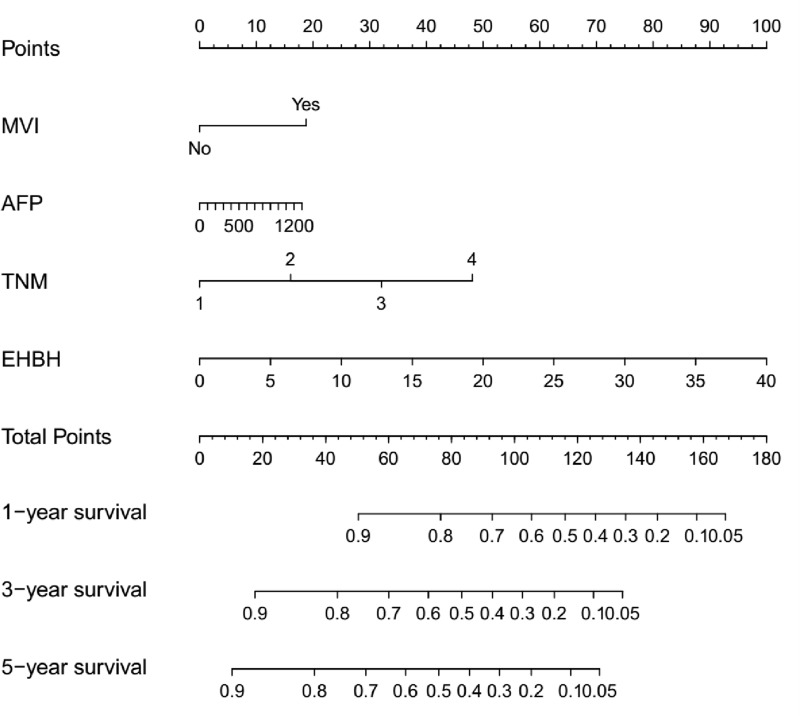
Figure 3.
HCC with cirrhosis survival nomogram. (To use the nomogram, an individual patient’s value is located on each variable axis, and a line is drawn upward to determine the number of points received for each variable value. The sum of these numbers is located on the Total Points axis, and a line is drawn downward to the survival axes to determine the likelihood of 1-, 3-, or 5-year survival). MVI, microvascular invasion.

