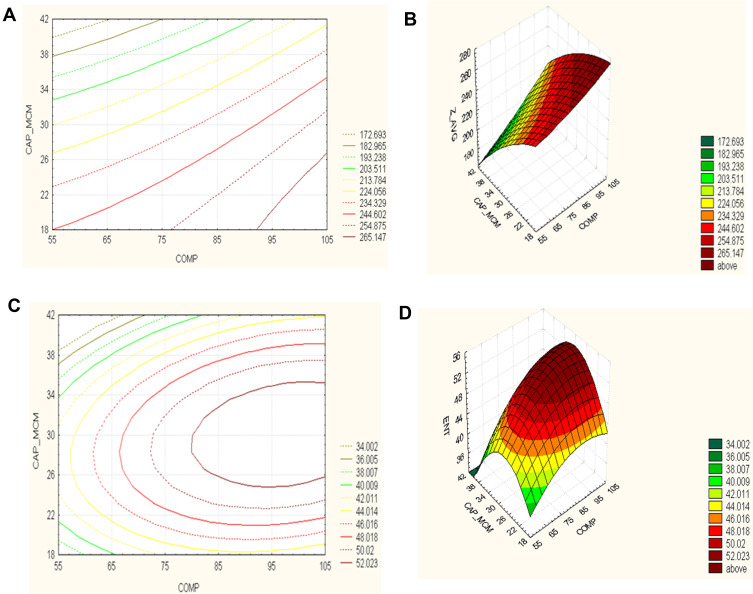
Figure 1.
(A) Contour plot of Zavg versus the amount of Compritol 888 and Capmul MCM; (B) response surface plot of Zavg versus the amount of Compritol 888 and Capmul MCM; (C) the contour plot of % drug entrapment vs the amount of Compritol 888 and Capmul MCM; (D) response surface plot of % drug entrapped vs the amount of Compritol 888 and Capmul MCM.

