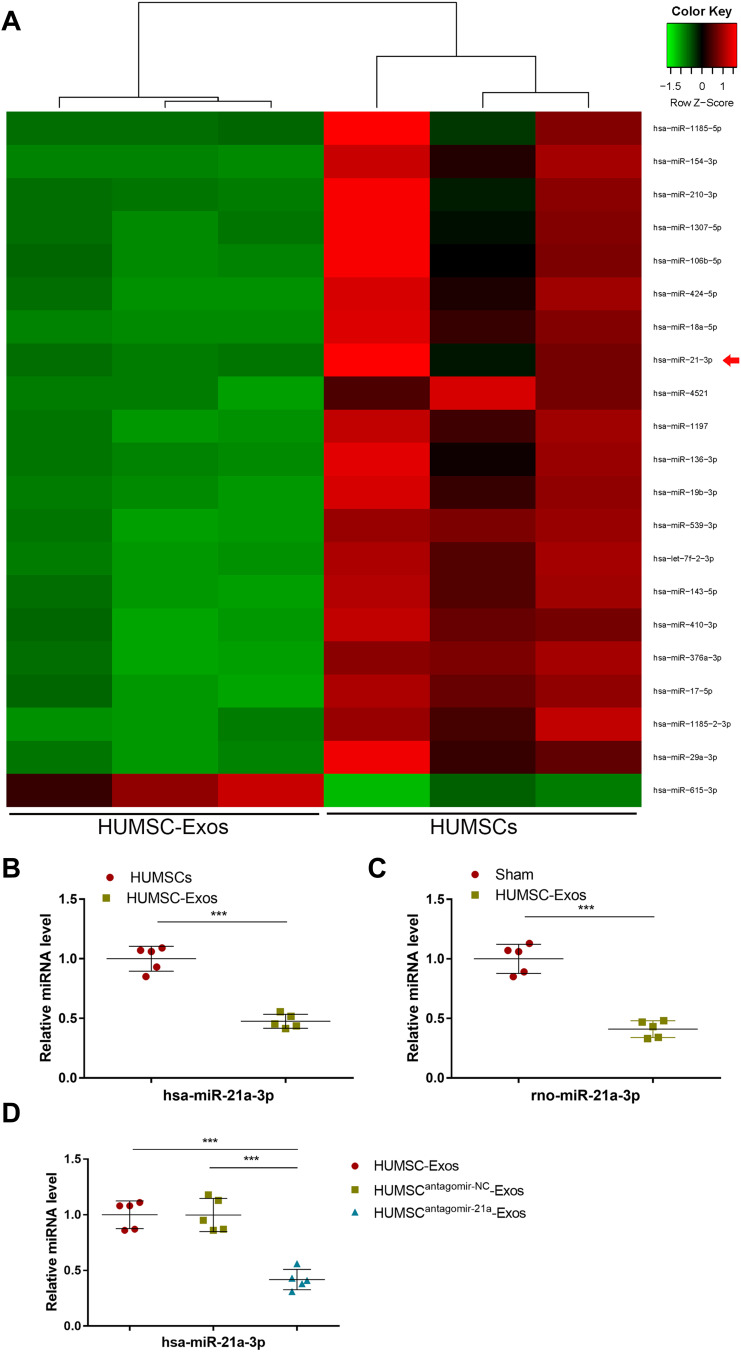
Figure 5.
HUMSC-Exos expressed low abundance of miR-21a-3p. (A) The top 20 miRNAs with the most significant differences. (B) qPCR analysis of has-miR-21a-3p in HUMSCs and HUMSC-Exos (n = 5 per group). (C) qPCR analysis of rno-miR-21a-3p in tendon tissues from C HUMSC-Exos and sham groups (n = 5 per group). (D) The expression of has-miR-21a-3p determined by qPCR (n = 5 per group). ***P < 0.001.

