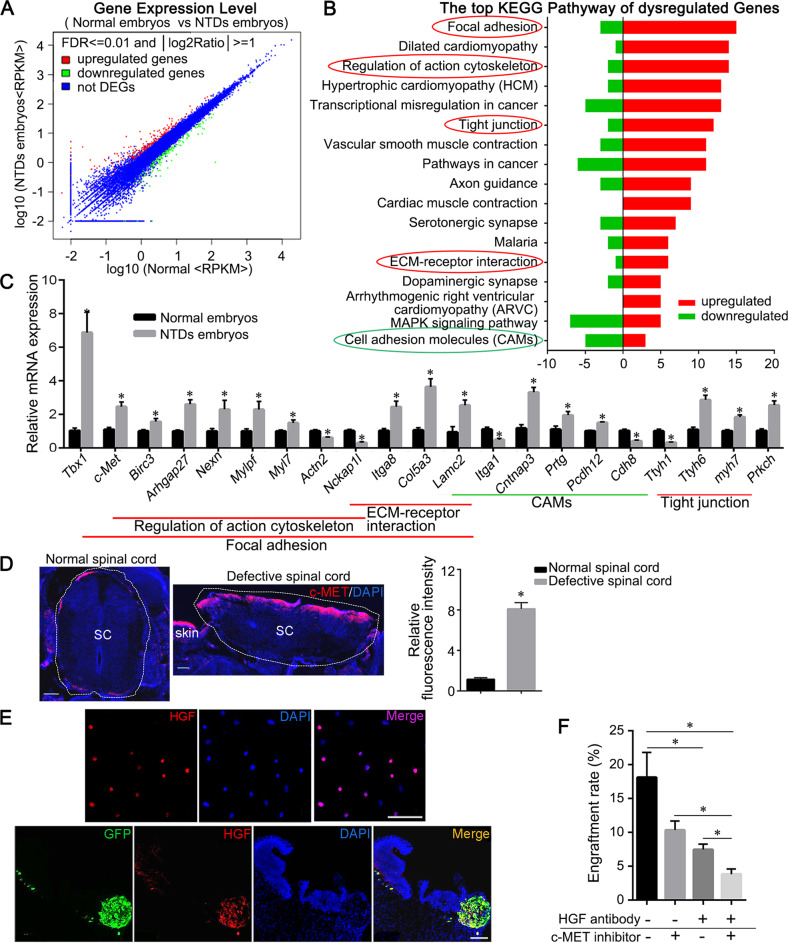
Fig. 4. Differentially expressed genes and KEGG pathways in NTD embryos.
a Scatter plot of differentially expressed mRNAs between the NTDs and normal rat embryos. Red dots indicate upregulated mRNAs, blue dots indicate equally expressed mRNAs, and green dots indicate downregulated mRNAs. The cut-off criteria were FDR ≤ 0.001 and |log2Ratio|≥ 1. Ratio = NTD embryos-RPKM/normal embryos-RPKM. b KEGG pathway analysis of differentially expressed genes (DEGs). The signaling pathways included the focal adhesion pathway, regulation of actin cytoskeleton pathway, tight junction pathway, ECM-receptor interaction pathway, and cell adhesion molecular pathway. The pathways of interest are indicated with circles. The red circles indicate the pathways with more upregulated genes. The green circle indicates the pathway with more downregulated genes. c Relative mRNA expression of the differentially expressed genes with |log2 fold change|>0.5, fold change = NTD embryos /normal embryos. (*P < 0.05, NTD embryos versus normal embryos). The expression levels were normalized to Gapdh. d Anti-c-MET (red) labeling of normal and defective spinal cords. The histogram shows the relative fluorescence intensities of c-MET in defective spinal cords compared with those of normal spinal cords (*P < 0.05, 10× field, n = 6). e Anti-HGF labeling in BMSCs cultured in vitro (top row) and engrafted GFP+ BMSCs in defective spinal cords following transplantation (bottom row). f Engraftment rate analysis for BMSCs, incubated without (–) or with (+) anti-HGF antibody for 1 h prior to BMSC transplantation into the amniotic cavity of NTD embryos without (–) or with (+) c-MET inhibitor treatment (*P < 0.05, n = 6 in per group). Scale bars: 100 μm.

