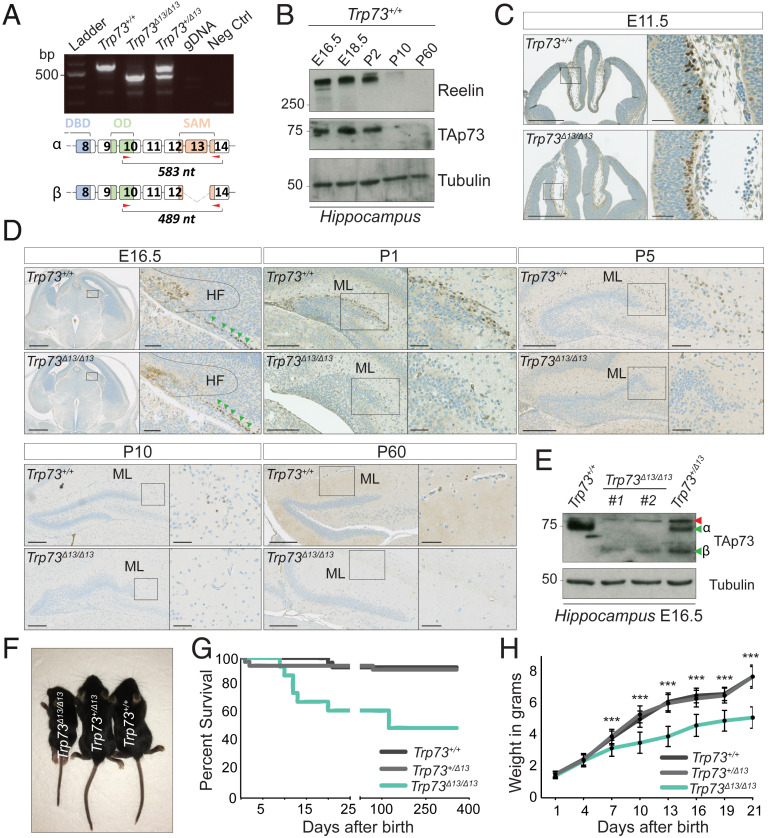
Fig. 1.
TAp73β replaces TAp73α in the early stages of Trp73Δ13/Δ13 brain development. (A, Top) RT-PCR was performed to analyze the mouse brain using primer pairs amplifying the C-terminal region (exons 10 to 14) of Trp73 mRNA. Trp73+/+ expresses only the α isoform (583 nt), Trp73Δ13/Δ13 expresses only the β isoform (489 nt), and Trp73+/Δ13 expresses both isoforms. (A, Bottom) The α and β C-terminal isoforms. Red arrows indicate the primer- targeted region. DBD, DNA-binding domain; OD, oligo dimerization domain; SAM, sterile α motif domain; gDNA, genomic DNA (from a Trp73+/+ mouse ear biopsy). (B) Western blot showing TAp73 during hippocampal development. Reelin expression follows a similar pattern. Trp73+/+ hippocampi at different developmental stages (E16.5, E18.5, P2, P10, and P60) were used for protein extraction. β-tubulin served as the loading control. (C) IHC performed on mouse brain at embryonic stage E11.5 using an antibody against the transactivation domain of p73 (positive signal in brown). (Left) Coronal section of the whole brain in Trp73+/+ (Top) and Trp73Δ13/Δ13 (Bottom) mice. (Scale bars: 500 µm.) (Right) Magnification of the strionuclear neuroepithelium showing TAp73-positive cells. (Scale bars: 50 µm.) (D) IHC in mouse brain coronal sections at E16.5, P1, P5, P10, and P60 using an antibody against TAp73 (positive signal in brown). At each embryonic stage, the box in the left images represents a magnification of what is shown in the images on the right. The dotted line indicates the HF, and the green arrows indicate TAp73-positive cells outside of the HF. (Scale bars: At E16.5, 500 µm in the left images and 50 µm in the magnifications; at P1, P5, P10, and P60, 200 µm in the left images and 50 µm in the magnifications.) (E) Western blot analysis performed on the mouse hippocampus at E16.5 using an antibody against the transactivation domain of p73. The red arrow indicates a nonspecific product. The green arrows indicate α and β isoforms; #1 and #2 are two different Trp73Δ13/Δ13 mice. β-tubulin served as a loading control. (F) Trp73Δ13/Δ13, Trp73Δ13/+, and Trp73+/+ 20-d-old mice (P20). (G) Percent survival in Trp73+/+ (n = 32), Trp73+/Δ13 (n = 40), and Trp73Δ13/Δ13 (n = 21) mice. P = 0.0012 for Trp73+/+ vs. Trp73Δ13/Δ13; P = 0.0019 for Trp73+/Δ13 vs. Trp73Δ13/Δ13; P = 0.84 for Trp73+/+ vs. Trp73+/Δ13, log-rank (Mantel–Cox) test. (H) Average weight of Trp73+/+ (n = 28), Trp73+/Δ13 (n = 37), and Trp73Δ13/Δ13 (n = 17) mice. Data are presented as mean ± SD. ***P < 0.001 for both Trp73+/+ vs. Trp73Δ13/Δ13 and Trp73+/Δ13 vs. Trp73Δ13/Δ13 at the indicated time points (from 7 to 21 d), two-way ANOVA with Bonferroni’s correction. At each time point (from 1 to 21 d), no significant statistical differences were seen when comparing Trp73+/+ vs. Trp73+/Δ13.

