Fig. 3.
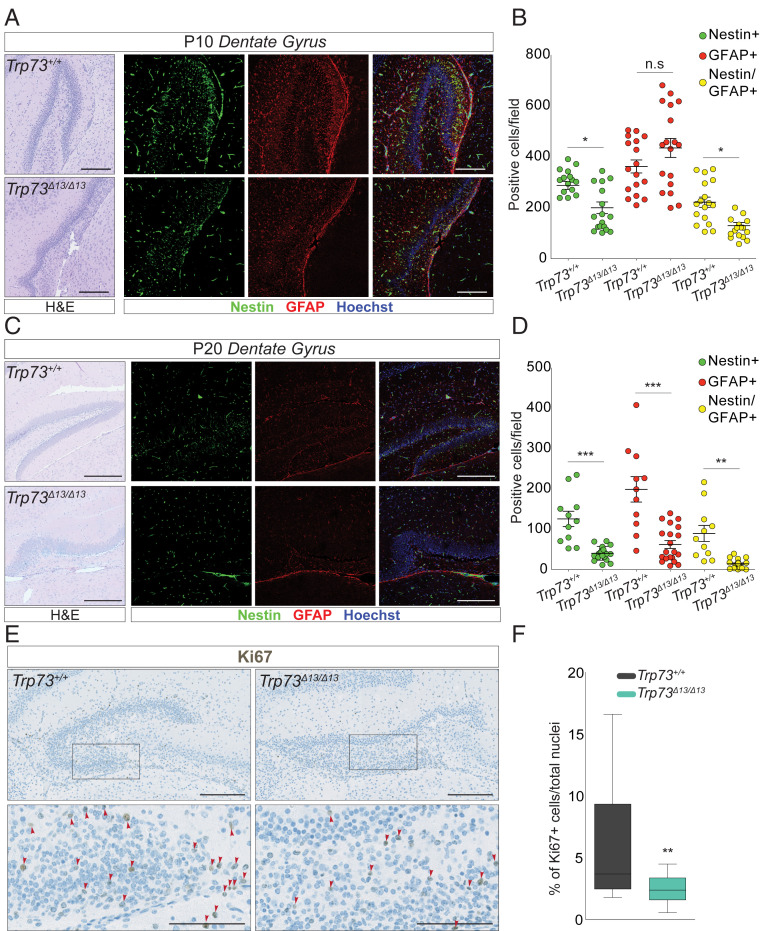
p73α depletion impairs adult neurogenesis in the DG. (A and B) Neurogenesis analysis performed on 10-d-old mice (P10). Representative IF images from Trp73+/+ (Top) and Trp73Δ13/Δ13 (Bottom). Nestin (green) and GFAP (red) mark the neuronal precursors in the DG. Hoechst (blue) marks the nuclei. (Scale bars: 200 µm.) (A) H&E-stained images showing the morphology of the area used for the IF. (B) Dot plot showing the number of Nestin-positive (green), GFAP-positive (red), or double-positive (yellow) cells per field in Trp73+/+ (n = 3) and Trp73Δ13/Δ13 (n = 3) mice. Data are presented as mean ± SEM. n.s., not significant. *P < 0.05, one-way ANOVA with Bonferroni’s multiple comparison test. (C and D) Neurogenesis analysis performed on 20-d-old mice (P20). (C) Representative IF images from Trp73+/+ (Top) and Trp73Δ13/Δ13 (Bottom) mice. Nestin (green) and GFAP (red) mark the neuronal precursors in the DG; Hoechst (blue) marks the nuclei. (Scale bar: 400 µm.) H&E images show the morphology of the area used for the IF. (D) Dot plot showing the number of Nestin-positive (green), GFAP-positive (red), or double-positive (yellow) cells per field in Trp73+/+ (n = 3) and Trp73Δ13/Δ13 (n = 3) mice. Data are presented as mean ± SEM. **P < 0.001; ***P < 0.0001, one-way ANOVA with Bonferroni’s multiple comparison test. Volocity software (PerkinElmer) was used to identify Nestin-positive, GFAP-positive, and Nestin/GFAP-positive cells. (E and F) Ki67 expression analysis by IHC of Trp73+/+ and Trp73Δ13/Δ13 mice at P5 and P10. (E) Ki67 representative IHC image from P5 mice. On the bottom (Left, Trp73+/+; Right, Trp73Δ13/Δ13), the magnified images (scale bars: 100 µm) correspond to the squares in the upper images (scale bars: 200 µm). (F) Boxplot showing the percentage of Ki67-positive cells in Trp73+/+ (n = 2 at P5; n = 3 at P10) and Trp73Δ13/Δ13 (n = 2 at P5; n = 3 at P10) mice. **P = 0.0011, two-way ANOVA with Bonferroni’s correction. Volocity software (PerkinElmer) was used to count Ki67-positive cells and total nuclei.

