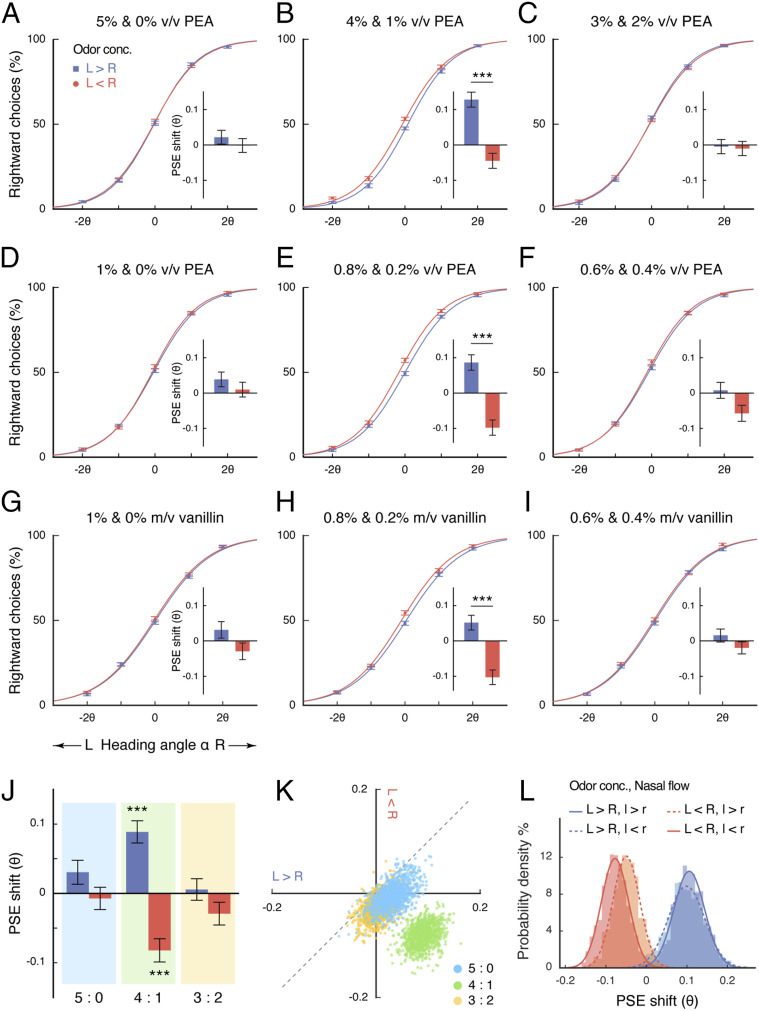
Fig. 2.
Dependence of directional smelling on internostril concentration ratio. (A–I) Psychometric functions and PSE shifts for Experiments 2 (A–C), 3 (D–F), and 4 (G–I). The numerical internostril concentration differences under high (A, D, and G), intermediate (B, E, and H), and low (C, F, and I) binaral disparities varied among the experiments, but the internostril concentration ratios were maintained. The average percentages of rightward responses at α = −4θ and 4θ were less than 1% and over 99%, respectively, and are not displayed. (J) Overall PSE shifts under different internostril concentration ratios across Experiments 2 to 4. (K) Bivariate distributions of 1,000 bootstrapped sample means for the PSE shifts under 5:0 (cyan), 4:1(lime), and 3:2 (orange) binaral disparities. The x and y axes, respectively, represent PSE shifts induced by receiving a higher concentration in the left nostril (L > R) and in the right nostril (L < R), relative to zero disparity (L = R). (L) Histogram distributions (with normal curves) of bootstrapped sample means for the PSE shifts under 4:1 binaral disparity with regard to the left–right relationships in odor concentration (L > R, L < R) and nasal airflow (l > r, l < r). Error bars indicate SEMs adjusted for individual differences. ***P < 0.001. conc., concentration; PEA, phenylethyl alcohol.

