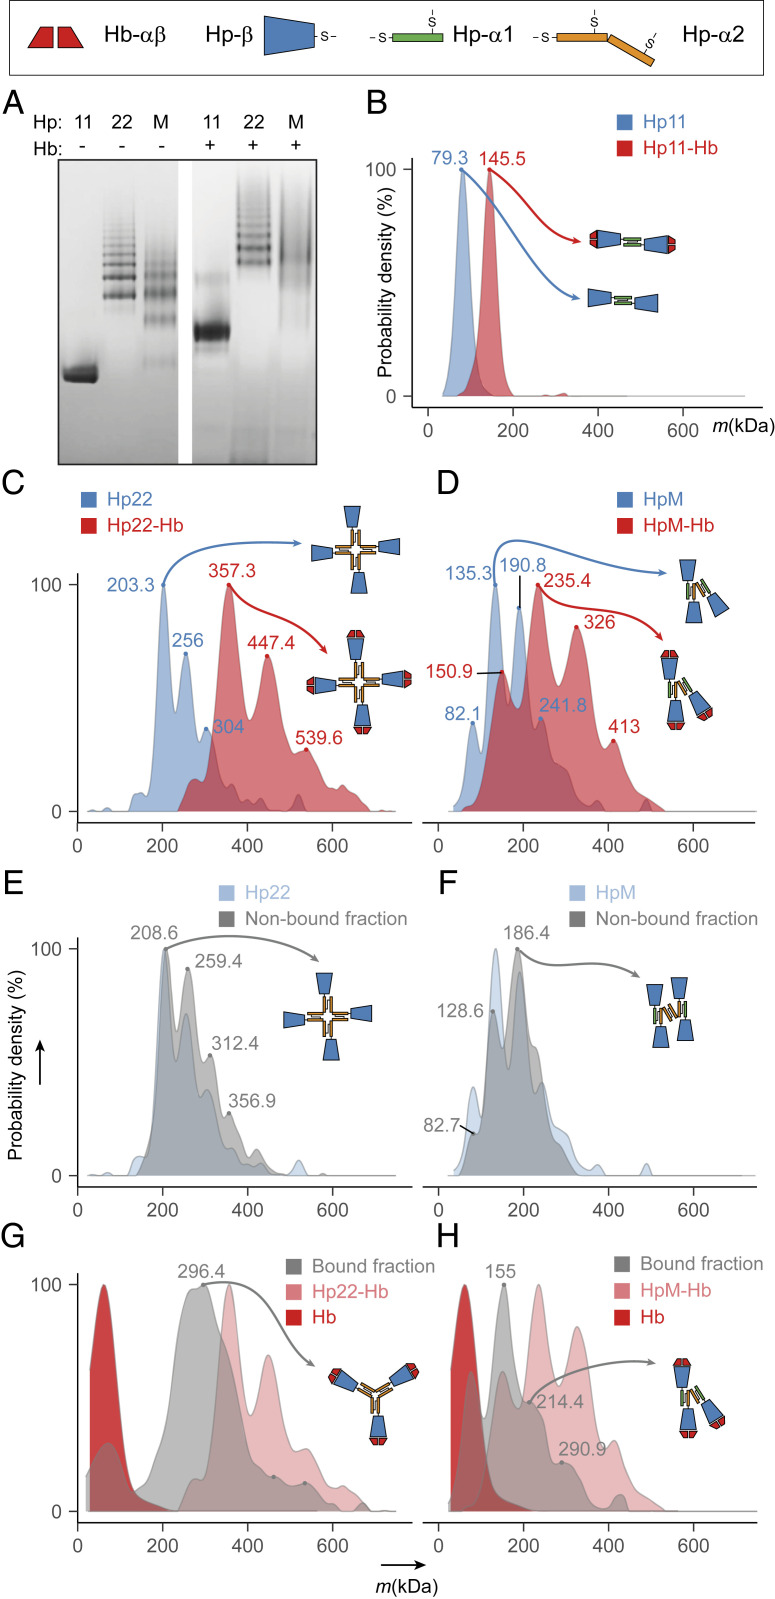
Fig. 2.
Hp oligomerization and Hb binding for different Hp genotypes. (A) Blue native-gel analysis of Hp 1-1, Hp 2-2, and Hp 2-1, represented by Hp M, alone (Left) and upon incubation with Hb (Right). (B) Mass photometry profiles obtained for Hp 1-1 (blue) and Hp (1, 1)-Hb (red) with the determined average molecular mass indicated on the peak apex. (C and D) Mass photometry profiles of Hp 2-2 and Hp (2, 2)-Hb (C) and of Hp M and Hp(M)-Hb (D). The blue profiles represent Hp alone and the red profiles correspond to Hb-bound Hp. (E and F) Constructed overlay of mass photometry profiles obtained for Hp 2-2 (E) or Hp M (F) and their respective Hb-unbound fractions (gray) demonstrates the relative depletion of larger oligomers in the Hb-unbound fraction. (G and H) Constructed overlay of mass photometry profiles obtained for Hp (2, 2)-Hb (G) or Hp(M)-Hb (H) and their respective Hb-bound fractions demonstrate enrichment of smaller oligomers. A mass profile of Hb alone is depicted in dark red. See also SI Appendix, Fig. S2 for a more detailed overview of all Hp oligomer mass measurements by using mass photometry.

