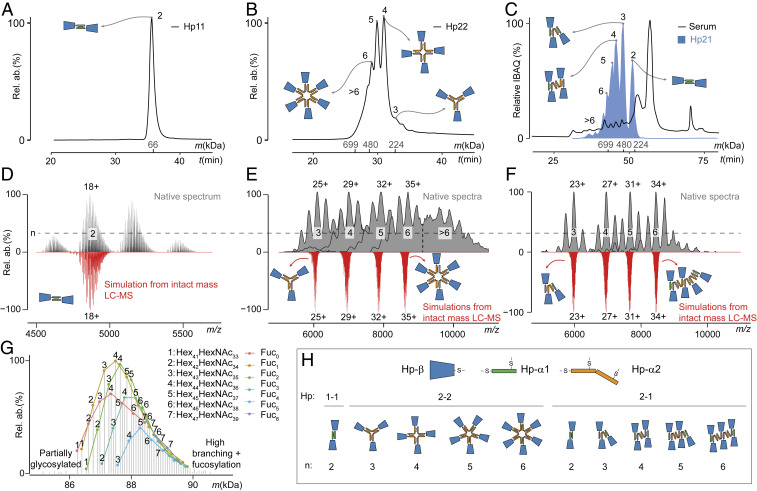
Fig. 3.
Characterization of SEC separated Hp oligomers by high-resolution native MS, and in silico reconstruction based on denatured intact protein LC-MS data. (A and B) SEC chromatograms of Hp 1-1 and Hp 2-2, respectively, with the apparent molecular mass and oligomerization status annotated. (C) SEC profile of serum from a donor with Hp 2-1 genotype (black line). The abundance profile of Hp proteins (based on iBAQ [intensity-based absolute quantification] proteomics values) is displayed in blue. (D–F) High-resolution native MS spectra of desialylated Hp 1-1 (D) and SEC separated oligomers of desialylated Hp 2-2 (E) and Hp 2-1 (F) (black) and corresponding in silico-generated spectra only for the most abundant charge states (red). (G) Annotation of peaks in the native MS spectrum of Hp 1-1 with integers corresponding to the base glycan composition and color denoting the number of terminal fucoses carried by Hp 1-1 (SI Appendix, Table S5). See also SI Appendix, Fig. S3 for annotations of the proteoforms of Hp 2-1 oligomers. (H) Cartoons of the complexes observed for Hp 1-1, Hp 2-2, and Hp 2-1 in the most abundant SEC fractions (A–C).

