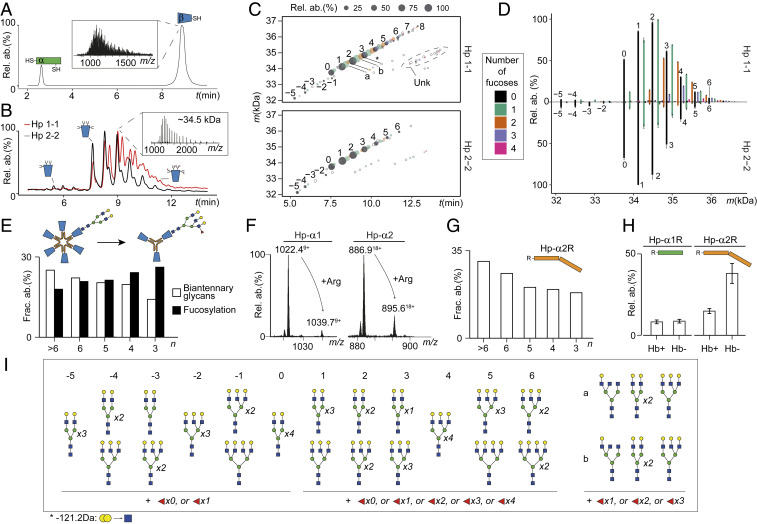
Fig. 4.
Sequence processing and N-glycosylation fine-tune Hp oligomerization and Hb binding. (A) Separation and detection of intact Hp 1-1 α- and β-proteoforms with reverse-phase LC-MS. The nonresolved glycoforms of Hp-β are shown in the Inset. (B) HILIC-LC-MS of Hp 1-1 and Hp 2-2 shows good separation of the Hp-β glycoforms, enabling accurate mass determination of each separated proteoform (Inset). (C) Proteoform elution maps obtained by HILIC-LC-MS of Hp 1-1 and Hp 2-2 depicting qualitatively and quantitatively all mass features detected in the samples as a function of retention time. The color and size of a dot reflect the number of fucoses carried by the glycoform and its relative abundance in the sample, respectively. Filled dots represent mass features detected in triplicate, empty circles represent mass features detected in only one LC-MS run. (D) Mirror plot of average abundances of Hp-β glycoforms in Hp 1-1 and Hp 2-2 based on the three technical replicates. Error bars represent SEM. The color scheme is the same as in C. (E) Levels of fucosylation (filled bar) and biantennary glycans (empty bar), as observed in Hp 2-2 oligomers. Illustratively, a schematic representation of a biantennary glycan attached to a higher Hp oligomer and a branched and fucosylated glycan on a smaller oligomer of Hp 2-2 is depicted above. (F) Mass (m/z) profiles of Hp-α proteoforms detected with and without Arg for Hp 1-1 and Hp 2-2. (G) Abundance levels of the noncleaved Hp-α2R form in distinct Hp 2-2 oligomers. (H) Abundance levels of noncleaved Hp-α1R and Hp-α2R in Hb-bound (Hb+) and Hb-unbound (Hb−) fractions following the above mentioned Hb-binding assays of Hp 1-1 and Hp 2-2 (see main text) reveal that the processing is crucial for tight Hb binding. (I) Overview of the primary glycan compositions for glycoforms of Hp-β depicted by the integer and lowercase Roman letters in C and D. Number of fucoses detected in this study is indicated underneath the glycan structures.

