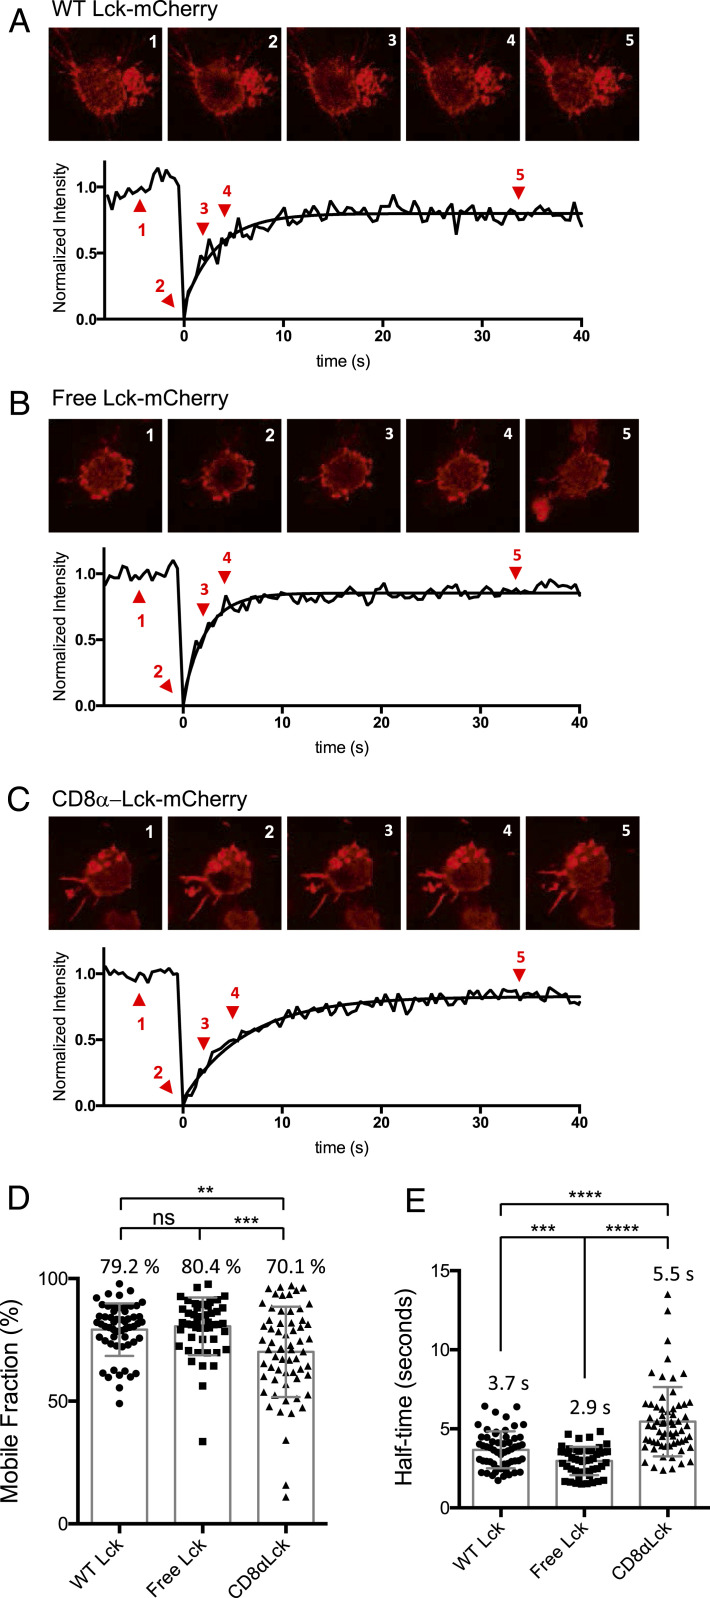
Fig. 1.
Mobility of free Lck and CD8α-Lck in OT-I hybridomas. OT-I.CD8αβ+.endoLck−/− hybridoma cells were transduced with WT Lck, C20.23A mutant Lck (free Lck), or CD8α-bound Lck that was fused with mCherry. The lipid bilayers contained mouse ICAM-1 and Streptavidin-Alexa Fluor 488. The hybridoma cells were loaded onto the lipid bilayers and incubated at 37 °C for at least 30 min prior to the FRAP imaging experiment. (A–C) The fluorescent intensity recovery curves of WT (A), free (B), and CD8α-bound Lck (C). The normalized intensity indicates the average intensity of the photobleached area normalized to prebleach, the fluorescence loss, and the first photobleach after background subtraction. The normalized intensity was fitted using one-phase association by Prism software. The cell images at prebleach (1, x = −4.5 s), bleach (2, x = 0 s), incomplete recovery (3, x = 2.2 s; 4, x = 4.4 s) and complete recovery (5, x = 34.4 s) are presented. The mobile fraction (D) and half-time (E) were analyzed by Prism software. The significance was analyzed by Student’s t test, ns, not significant; *P < 0.05; **P < 0.01; ***P < 0.001; and ****P < 0.0001. Mean ± SEM of WT Lck, n = 56; free Lck, n = 48; and CD8α-Lck, n = 63 are shown. The figure is representative of three independent experiments.

