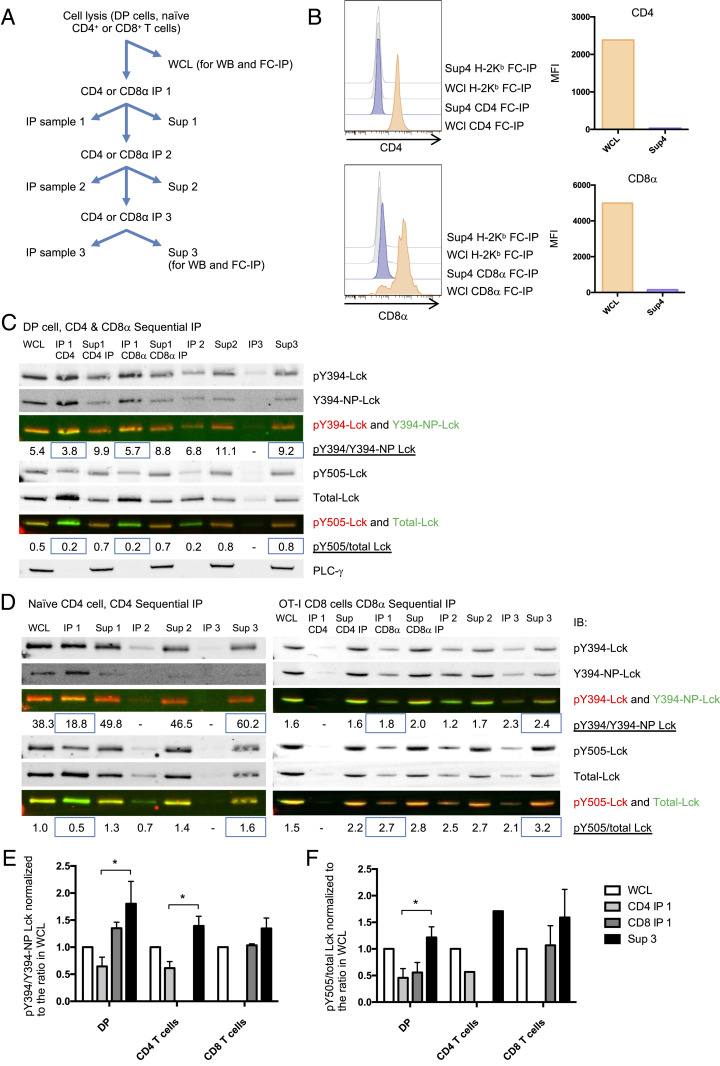
Fig. 3.
Higher Y394 phosphorylation in free Lck than CD8-bound Lck fraction in mouse primary DP and peripheral T cells. (A) Illustration of the sequential IP method. (B) DP cell WCL and supernatant 3 (40 μL each) were harvested for FC-IP analysis. CD4, CD8α, or H2Kb coated beads were added into the WCL or supernatant 3 and incubated overnight. Beads were washed and stained with anti-CD4-PE or anti-CD8β-PE antibodies. Histograms of the CD4, CD8β, and background (H2Kb beads) staining (B, Left) and the MFI subtracted backgrounds (B, Right) are presented. (C) CD4 and CD8α sequential IP was performed on DP thymocytes. (D, Left) CD4 sequential IP was performed on naïve CD4+ T cells sorted from WT mouse lymphocytes. (D, Right) CD8α IP was performed on naïve CD8 T+ cells sorted from OT-I transgenic mice. The pY394-Lck, Y394-nonphospho Lck, pY505-Lck, and total Lck were detected by WB. pY394 Lck was detected by anti-pY416-Src antibody. The intensity ratio pY394/Y394-nonphosphorylated Lck and Y505/total Lck were quantified and indicated on the figure. C is representative of three independent experiments; D is representative of two independent experiments. (E and F) The pY394/Y394-NP-Lck and Y505/total Lck intensity ratios on each WB gel were normalized to WCL samples. E and F represent the summary of three repeats of DP cells and two repeats of naïve CD4 and naïve CD8 cells. The significance was analyzed by paired t test, *P < 0.05. Mean ± SEM is shown.

