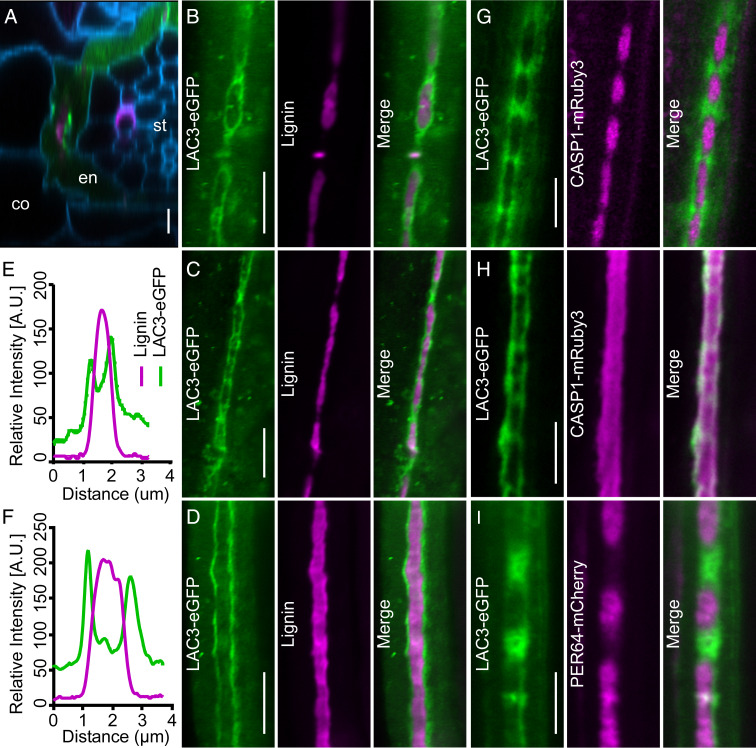
Fig. 1.
Surface view of LAC3 localization during CS development. (A) Radial section of a proLAC3::LAC3-eGFP root showing LAC3-eGFP (green) in relation to lignin (basic fuchsin, magenta) and the cell wall (calcofluor white, blue). co, cortex; en, endodermis; st, stele. (B–D) Localization of LAC3-eGFP (green) at the string-of-pearls (B), transition (C), and mature (D) stage of CS development in relation to lignin. (E and F) Quantification of relative LAC3-eGFP and basic fuchsin fluorescence intensity in C and D. (G and H) Localization of LAC3-eGFP (green) and CASP1-mRuby3 (magenta) at the string-of-pearls (G) and mature (H) stage in the dual reporter line. (I) Localization of LAC3-eGFP (green) and PER64-mCherry (magenta) at the string-of-pearls stage in the dual reporter line. (Scale bars, 5 μm.)

