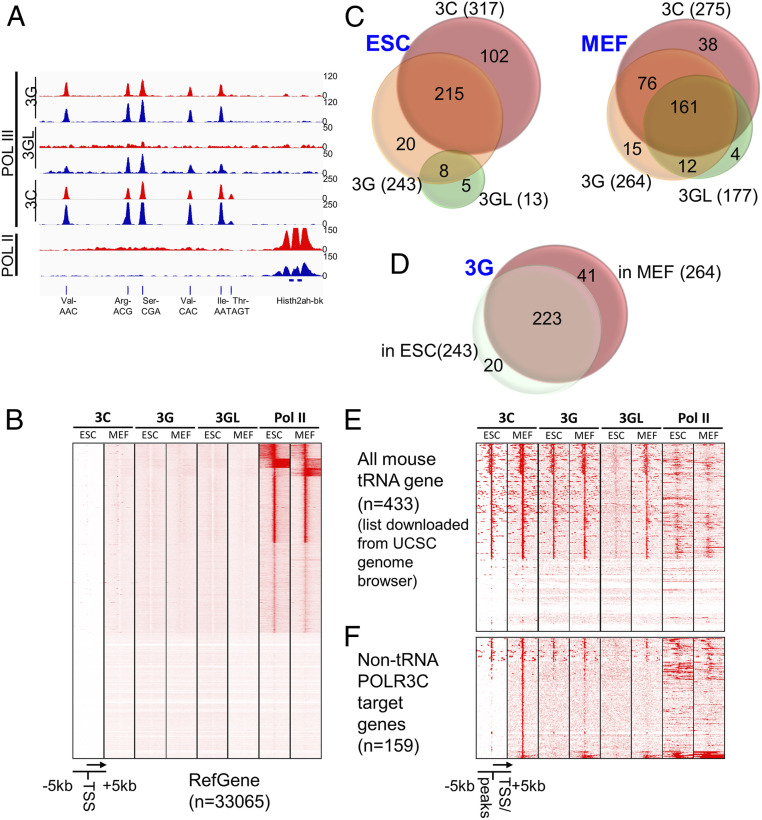
Fig. 2.
Genome-wide POLR3C, POLR3G, and POLR3GL occupancy in mouse ESCs and MEFs. (A) Representative Integrative Genomics Viewer view showing the ChIP-seq signals of POLR3C, POLR3G, POLR3GL, and Pol II at the tRNA cluster of Chr13. The binding profiles in ESCs are shown in red, while the profiles in MEFs are shown in blue. (B) Heatmap showing no detectable POLR3C, POLR3G, and POLR3GL occupancy at most Pol II-transcribed genes, thereby indicating the specificity of the antibodies for Pol III-transcribed genes. (C) Venn diagrams showing overlaps of POLR3C, POLR3G, and POLR3GL target sites in ESCs (Left) and MEFs (Right). (D) Venn diagram showing overlap of POLR3G target sites in ESCs and primary MEFs. (E and F) Heatmaps showing the ChIP-seq signals of POLR3C, POLR3G, POLR3GL, and Pol III at all murine tRNA loci (E) and non-tRNA targets of PLOR3C (F) in ESCs and MEFs.

