Fig. 2.
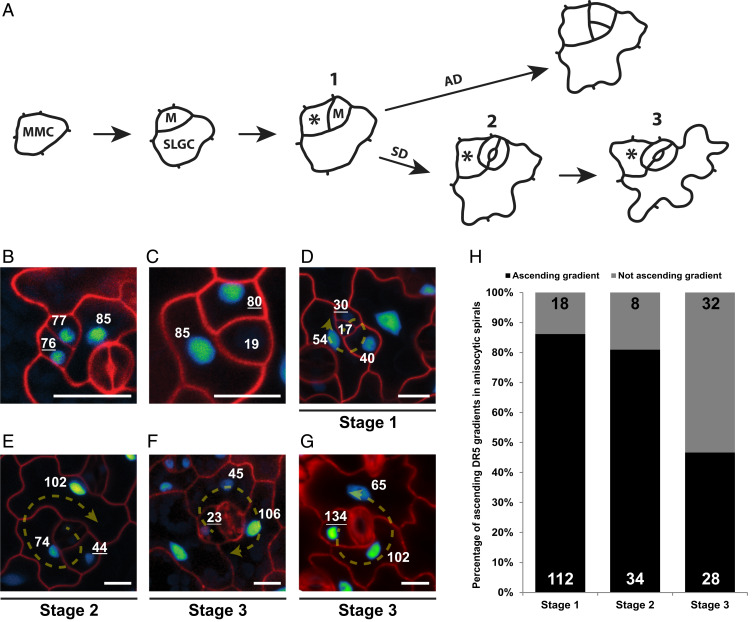
Ascending auxin response gradient within the spirals of stomatal complexes. (A) Scheme representing the fate of a meristemoid cell, which can undergo either an asymmetric (AD) or symmetric (SD) division to produce an SLGC or stomatal guard cells, respectively. Numbers represent three different stages into which the spiral complexes were divided: 1) nonlobed youngest SLGC next to a meristemoid; 2) nonlobed youngest SLGC next to a stoma; and 3) lobed youngest SLGC next to a stoma. Asterisks mark the youngest SLGC in each stage. MMC, meristemoid mother cell. (B) DR5::Venus-NLS expression is similar in the newly formed meristemoid and SLGC after an asymmetric division. (C) Depletion of the DR5::Venus-NLS signal from the guard mother cell before a symmetric division. (D–F) Representative images of DR5::Venus-NLS signal distribution within anisocytic stomatal complexes at the different stages shown in A. The directions of the spiral division patterns are shown by arrows. (G) Example of a descending youngest-to-oldest DR5 signal gradient, with the youngest SLGC exhibiting highest DR5::Venus-NLS signal distribution within a single anisocytic spiral. The direction of the spiral division pattern is shown by an arrow. (B–G) Cell walls are stained with propidium iodide. Numbers represent quantified DR5 fluorescence signal intensity in the nucleus. Underlined numbers mark the youngest SLGC. (Scale bars, 10 μm.) (H) Quantification of the frequency of ascending DR5 signal distribution gradients from youngest to oldest cells within anisocytic stomatal complexes at the different stages shown in A; n values are displayed in the graph.

