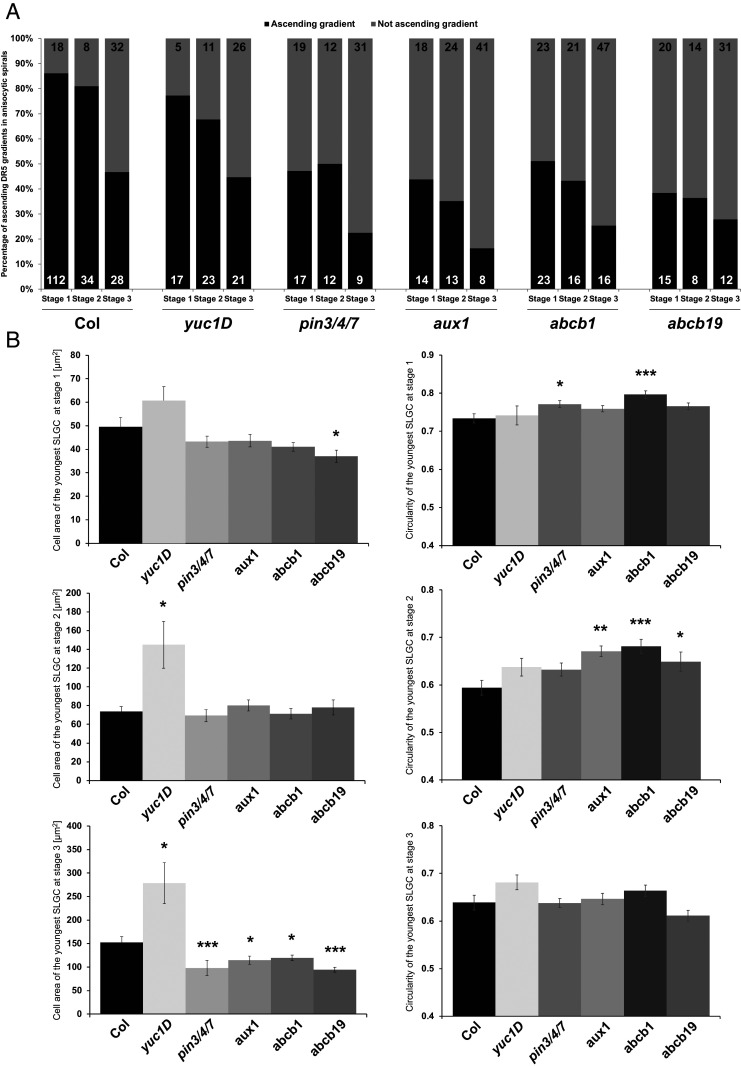
Fig. 3.
Auxin transport mutants reveal defects in auxin reporter distribution in anisocytic stomatal spirals. (A) Quantification of the frequency of ascending DR5::Venus-NLS signal distribution gradients from youngest to oldest cells within anisocytic stomatal complexes at the different stages (shown in Fig. 2A) in Col, yuc1D, aux1, abcb1, abcb19, and pin3/4/7 mutants. n values are displayed in the graphs. (B) Cell area and circularity quantification of the youngest SLGCs from the anisocytic stomatal complexes of the mutants at stage 1, 2, or 3. Asterisks on the schemes mark the youngest SLGCs, on which the quantifications were performed. Error bars correspond to ±SE. Statistical significance compared with the Columbia wild type was tested by Wilcoxon test (*P < 0.05, **P < 0.01, ***P < 0.001).

