Fig. 4.
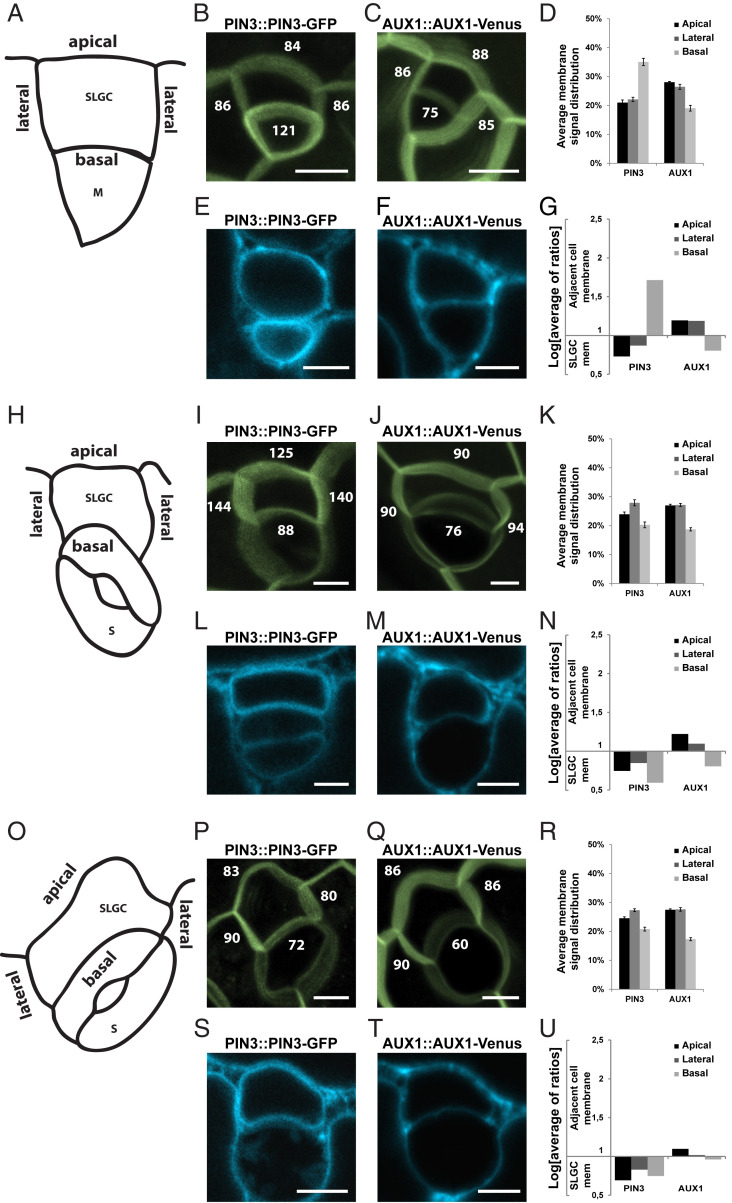
Dynamic relocalization of auxin transporters during lobe formation. (A) Scheme representing a stage 1 SLGC with apical, basal, and lateral membranes indicated. (B and C) Maximal-intensity projections of Z scans of PIN3::PIN3-GFP (B) and AUX1::AUX1-Venus (C) in SLGCs from stage 1. Numbers represent quantified Venus/GFP signal intensity at the membranes. (D) Quantification of Venus/GFP signal distribution of PIN3::PIN3-GFP and AUX1::AUX1-Venus at the membranes of SLGCs from stage 1. (E and F) Representative single-plane images of PIN3::PIN3-GFP (E) and AUX1::AUX1-Venus (F) in SLGCs from stage 1 after plasmolysis. (G) Quantification of Venus/GFP signal distribution of PIN3::PIN3-GFP and AUX1::AUX1-Venus at the membranes of SLGCs from stage 1 and adjacent cells after plasmolysis. (H) Scheme representing a stage 2 SLGC with apical, basal, and lateral membranes indicated. (I and J) Maximal-intensity projections of Z scans of PIN3::PIN3-GFP (I) and AUX1::AUX1-Venus (J) in SLGCs from stage 2. Numbers represent quantified Venus/GFP signal intensity at the membranes. (K) Quantification of Venus/GFP signal distribution of PIN3::PIN3-GFP and AUX1::AUX1-Venus at the membranes of SLGCs from stage 2. (L and M) Representative single-plane images of PIN3::PIN3-GFP (L) and AUX1::AUX1-Venus (M) in SLGCs from stage 2 after plasmolysis. (N) Quantification of Venus/GFP signal distribution of PIN3::PIN3-GFP and AUX1::AUX1-Venus at the membranes of SLGCs from stage 2 and adjacent cells after plasmolysis. (O) Scheme representing a stage 3 SLGC with apical, basal, and lateral membranes indicated. (P and Q) Maximal-intensity projections of Z scans of PIN3::PIN3-GFP (P) and AUX1::AUX1-Venus (Q) in SLGCs from stage 3. Numbers represent quantified Venus/GFP signal intensity at the membranes. (R) Quantification of Venus/GFP signal distribution of PIN3::PIN3-GFP and AUX1::AUX1-Venus at the membranes of SLGCs from stage 3. (S and T) Representative single-plane images of PIN3::PIN3-GFP (S) and AUX1::AUX1-Venus (T) in SLGCs from stage 3 after plasmolysis. (U) Quantification of Venus/GFP signal distribution of PIN3::PIN3-GFP and AUX1::AUX1-Venus at the membranes of SLGCs from stage 3 and adjacent cells after plasmolysis. For all graphs, the values of two lateral membranes from one SLGC were averaged. Values from plasmolysis were log-transformed to reduce skewness; log = 1 represents an equal distribution of the signal between membranes of the SLGC and adjacent cell. Means ± SE are shown. (Scale bars, 10 μm.)

