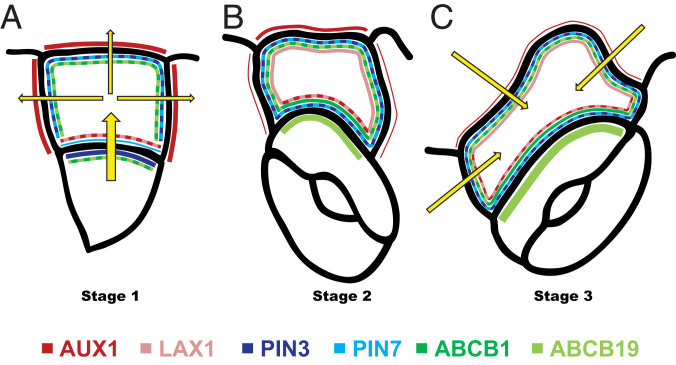
Fig. 5.
Model representing auxin transporter distribution at different membranes of SLGCs and adjacent cells. (A) Distribution of auxin transporters at stage 1. (B) Distribution of auxin transporters at stage 2. (C) Distribution of auxin transporters at stage 3. Line thickness represents transporter abundance. Yellow arrows represent auxin flow.

