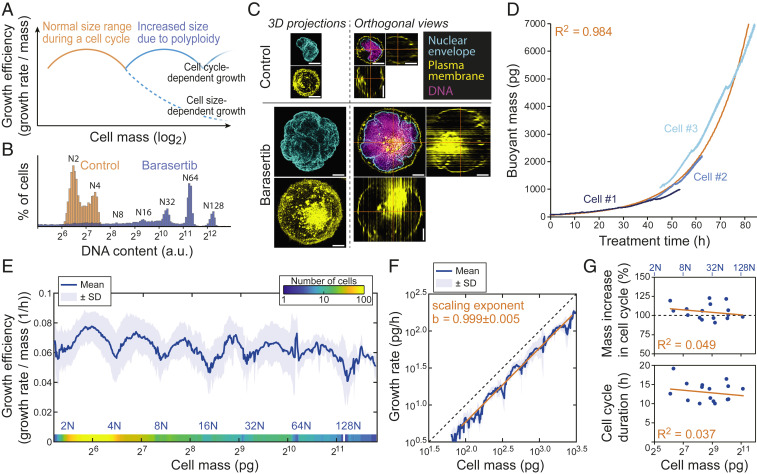
Fig. 3.
Monitoring growth of polyploid cells over a 100-fold size range reveals that growth is not size limited. (A) Hypothesis of cell growth regulation as cells increase size during endomitotic cycles. In the size range observed during a normal cell cycle (orange), cells display nonlinear size scaling of growth efficiency. When cells grow into polyploidy, cell size-dependent (dashed blue line) and cell cycle-dependent (solid blue line) growth should result in different growth behaviors. (B) Representative DNA histograms of control (orange) and 80-h 50 nM Barasertib-treated (blue) L1210 FUCCI cells (n = 3 independent cultures). (C) Representative morphologies of control (Top) and 50 nM Barasertib-treated (Bottom) L1210 FUCCI cells based on nuclear envelope (cyan), plasma membrane (yellow), and DNA (magenta) staining (n = 2 independent experiments each with >10 fields of view). Three-dimensional projections (Left) and single z slices with orthogonal views (Right) are displayed. (Scale bars: 5 µm.) (D) Three example buoyant mass traces from 50 nM Barasertib-treated L1210 FUCCI cells obtained using the large-channel SMR. Exponential fit to the three examples and Pearson correlation (R2) are displayed in orange. (E) The combined growth efficiency of control, 50 nM Barasertib, and 10 µM H-1152–treated L1210 FUCCI cells across a large mass range as measured with both small- and large-channel SMRs (n = 76 independent experiments across all conditions, number of cells is indicated with color gradient at the bottom). Estimated ploidy level is displayed on bottom in blue. (F) Growth rate as a function of mass on a log10–log10 scale when analyzing only 50 nM Barasertib-treated L1210 FUCCI cells measured with the large-channel SMR (n = 31 independent experiments). Linear fit and scaling exponent b (mean ± SEM) are displayed in orange. Perfect isometric scaling (b = 1) is illustrated with dashed black line. (G) Correlations between cell mass at the beginning of each cell cycle and percent mass increase during each cell cycle (Top) and cell cycle duration (Bottom). The data represent 50 nM Barasertib-treated L1210 FUCCI cells measured with the large-channel SMR (n = 11 independent experiments, n = 16 endomitotic cycles). The dashed black line at Top represents a perfect mass doubling in each endomitotic cycle. Approximate ploidy level at the start of each cell cycle (blue); linear fits (orange) and Pearson correlations (R2) are displayed.

