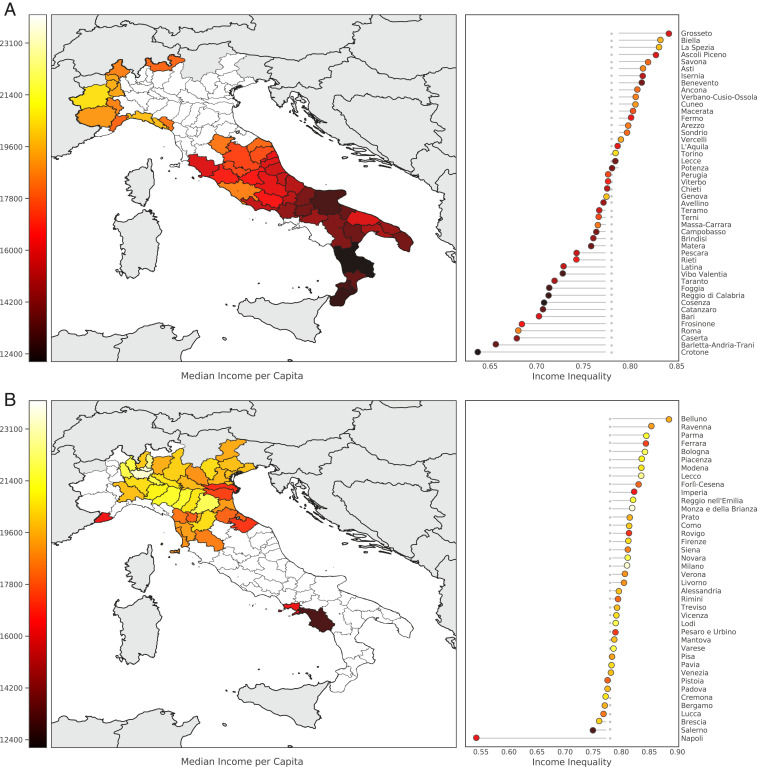
Fig. 2.
Characteristics of the (A) most affected and (B) the least affected municipalities aggregated at the province level. (Left) Geographic distributions with colors corresponding to median income per capita in every province. (Right) Position of each province in the distribution of income inequality with respect to the average inequality in the sample (gray dotted line). Italian regions with no available data have been grayed out.

