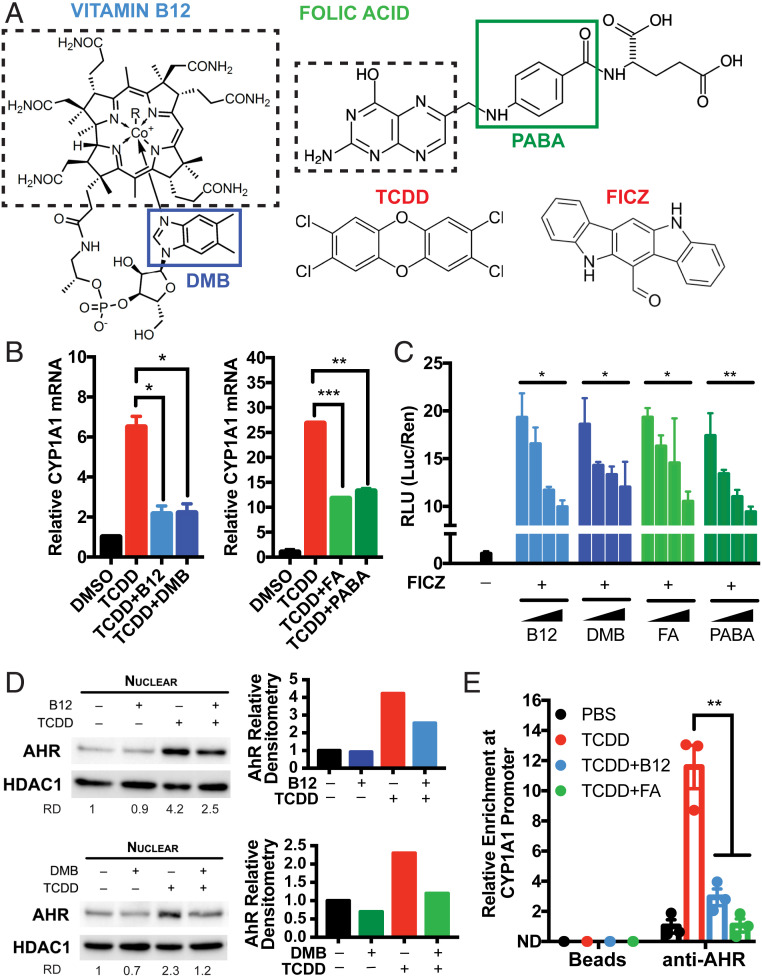
Fig. 1.
B12 and FA suppress AhR transcriptional activity induced by AhR agonists. (A) Chemical structures of vitamin B12 and folic acid (FA) alongside prototypical AhR agonists TCDD and FICZ. The solid boxes indicate the moieties of B12 and FA that contain aryl hydrocarbon rings: DMB and PABA, respectively. The dashed boxes indicate portions of B12 and FA that are involved in methyl donation in the 1C cycle. (B) HepG2 human hepatoma cells were pretreated with 5,000 pg/mL B12 (with recombinant B12 carrier protein 5 pM TCN2), 3.4 nM DMB, 50 ng/mL FA, or 113 nM PABA for 8 h and treated with 0.5 nM TCDD for 5 h. Relative CYP1A1 mRNA was measured by RT-qPCR and normalized to HPRT1 and DMSO-treated samples. Data are means ± SE (n = 2). *P < 0.05, **P < 0.01, and ***P < 0.001 vs. TCDD-treated samples assessed by Student’s t test. (C) HepG2 cells were transfected with pGL4.43 XRE-luc2P and pGL4.75 CMV-Ren plasmids for 24 h, pretreated with serial 100-fold dilutions of B12/TCN2 (maximum [max] concentration: 5,000 pg/mL B12 with 5 pM TCN2), DMB (max, 3.4 nM DMB), FA (max, 50 ng/mL), or PABA (max, 113 nM) for 8 h, and treated with 1 nM FICZ for 12 h. Luminescence from cell lysates were measured by commercial kit and analyzed by microplate reader. Relative luciferase units (RLUs) were calculated by normalizing firefly luciferase signal with Renilla luciferase signal within each sample and further normalizing with DMSO-treated samples. *P < 0.05, **P < 0.01 assessed by linear regression of RLU vs. log(concentration). (D) HepG2 cells were treated with 0.5 nM TCDD in the presence of 5,000 pg/mL B12 (with 5 pM TCN2) or 3.4 nM DMB for 24 h. Nuclear expressions of AhR and HDAC1 were measured by Western blotting. Relative densitometry (RD) of AhR blots were quantified by ImageJ. (E) HepG2 cells were treated with 0.5 nM TCDD in the presence of 5,000 pg/mL B12 (with 5 pM TCN2) and 50 ng/mL FA for 2 h. Chromatin immunoprecipitation (ChIP) was performed with anti-AhR antibodies and protein G magnetic beads. Binding at the putative AhR binding site CYP1A1 promoter was measured by RT-qPCR and normalized to 5% input. Data are means ± SE (n = 3). **P < 0.01 vs. TCDD-treated samples assessed by Student’s t test.

