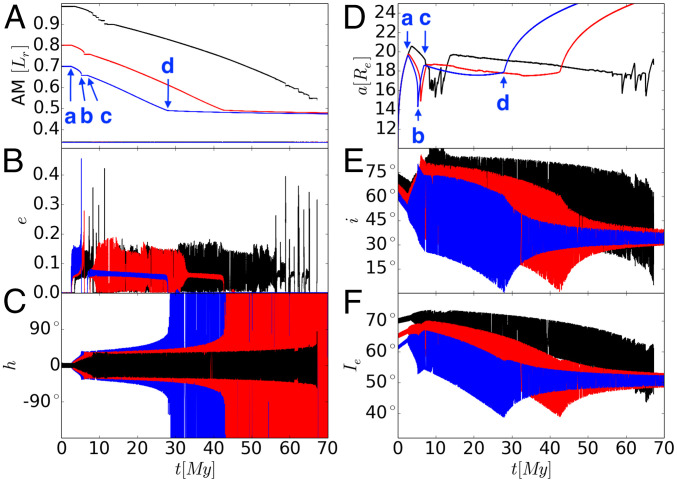
Fig. 2.
Details of LPT [(A) angular momentum, (B) lunar eccentricity, (C) the angle between the ascending node of the lunar orbit and the ascending node of the Earth’s equator, (D) lunar semimajor axis, (E) lunar inclination, and (F) Earth’s obliquity], with -consistent initial conditions (in [, ]): (, 0.7 [blue]), (, 0.8 [red]), (, 0.98 [black]). Parameters are as follows: , . In A, the top lines are (), and the horizontal line is (). The fact that the line is horizontal indicates that it is conserved by the evolution. Most of the decline in occurs when both is nonzero and oscillates. For the blue curves, a and d mark the beginning and end of the LPT.

