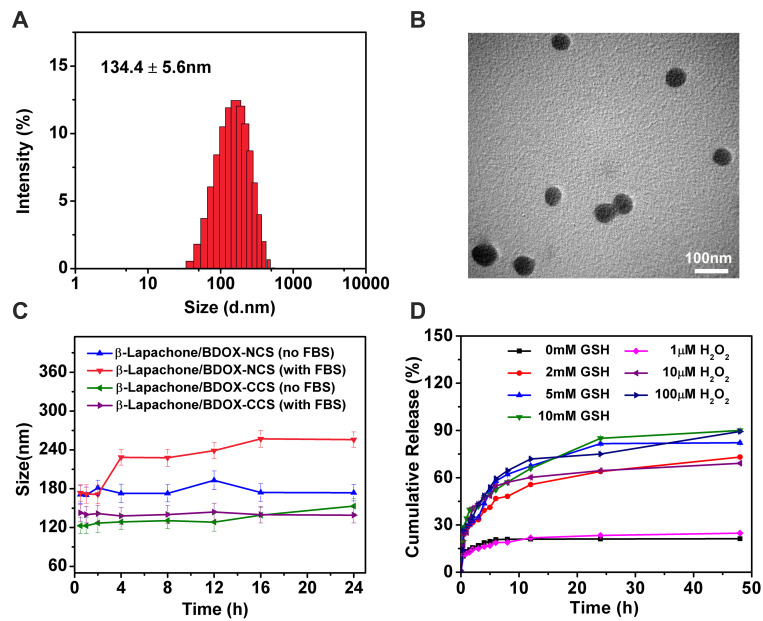
Figure 2.
Characterization of the NDDSs. (A) The size distribution. (B) TEM images of β-Lapachone/BDOX-CCS. (C) The average size change of β-Lapachone/BDOX-NCS and β-Lapachone/BDOX-CCS when incubated with PBS (pH = 7.4) and 10% fetal bovine serum (FBS). (D) In vitro β-Lapachone/BDOX-CCS drug release profiles in PBS at different concentrations of glutathione (GSH) and H2O2. Data are presented as mean ± SD (n = 3).

