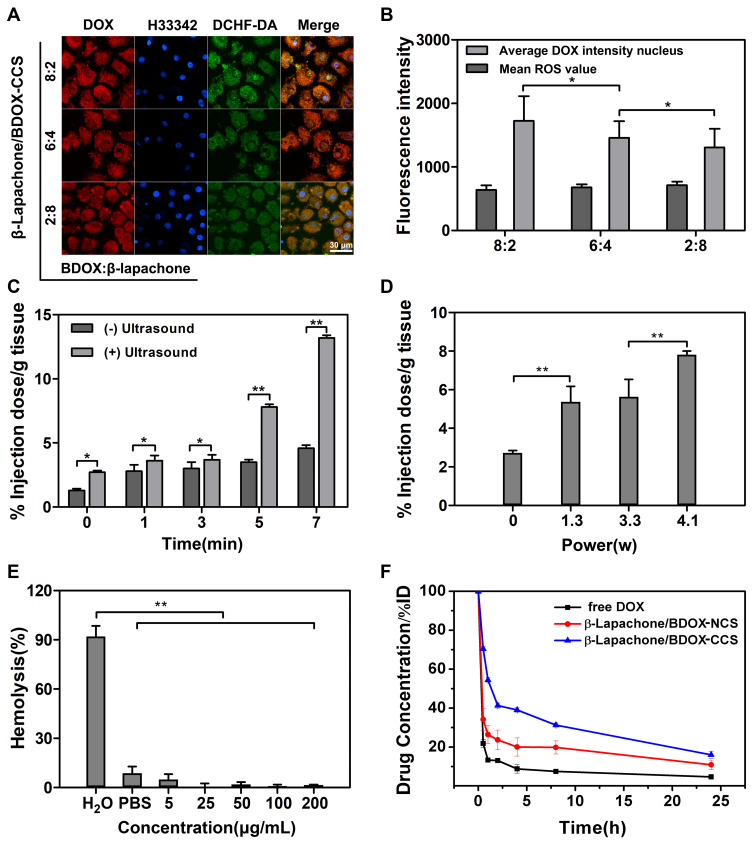
Figure 4.
Confocal images of DOX and ROS within the cells following treatment with (A) BDOX and β-Lapachone in β-Lapachone/BDOX-CCS in the following ratios 8:2, 6:4, 2:8 in molar ratio (n=6). (B) Average DOX fluorescence in the nucleus and ROS in whole cells was calculated based on the confocal images. (C–F) Analysis of ultrasound-enhanced tumor vascular permeability, biocompatibility, and pharmacokinetics of β-Lapachone/BDOX-CCS. In vivo Quantification of the variable degree of permeability performed at different (C) times (4.1w) and doses (5 min) (D). The FD 40 fluorescence in tumor tissues was evaluated using a UV-Vis spectrometer. (E) The hemolysis test of β-Lapachone/BDOX-CCS at different concentrations (5, 25, 50, 100, and 200 µg mL−1) in PBS. (F) Blood drug concentrations against time following one intravenous dosage with free DOX, β-Lapachone/BDOX-NCS, and β-Lapachone/BDOX-CCS at a DOX-equivalent dose of 5 mg kg−1. All results were calculated based on three independent experiments (*p<0.05, **p<0.01).

