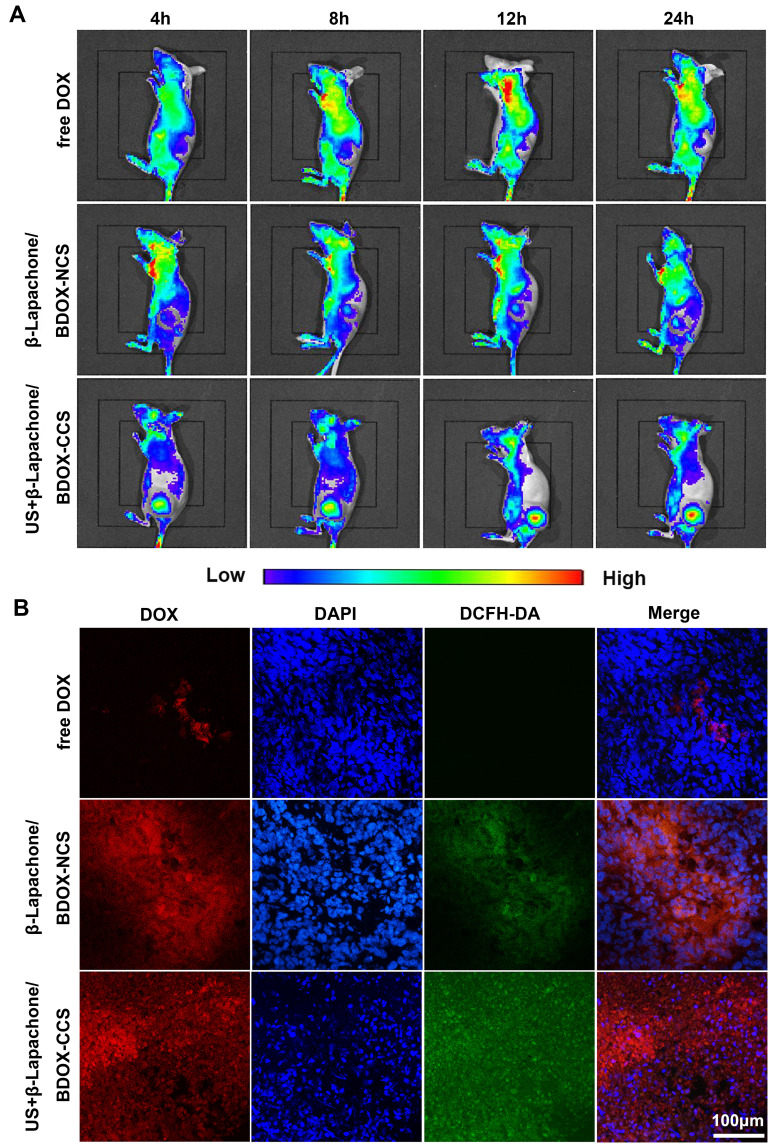
Figure 5.
The biodistribution of β-Lapachone/BDOX-CCS. (A) images of in vivo fluorescence of different formulations injected into the mice at different time points (n = 3). (B) Fluorescent images of HepG2 tumors, 24 h post-treatment with the indicated formulations, collected using CLSM. ROS (green) was measured by injecting DCFH-DA into tumors. Nuclei were stained blue with DAPI.

