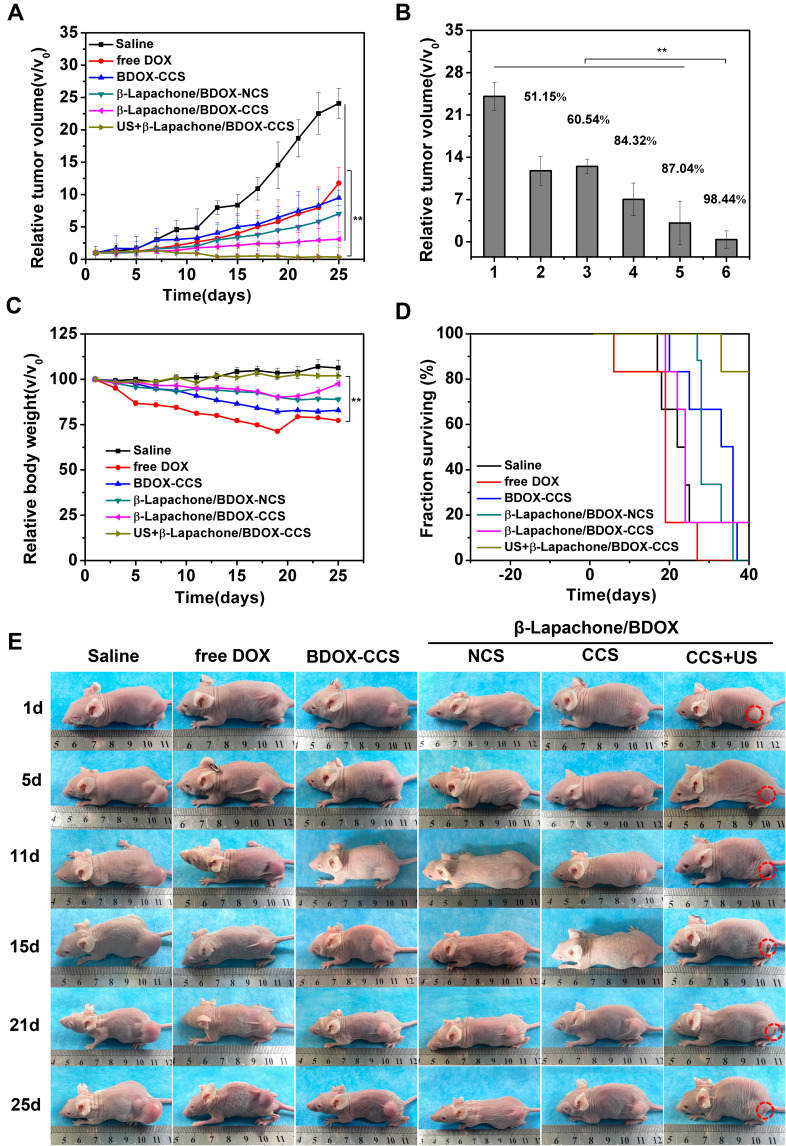
Figure 7.
In vivo antitumor efficacy in a xenograft HepG2 mice model. (A) Xenograft HepG2 tumor growth profiles following treatment using saline, free DOX, BDOX-CCS, β-Lapachone/BDOX-NCS, β-Lapachone/BDOX-CCS, and US + β-Lapachone/BDOX-CCS (n = 6). (B) Tumor volume inhibition ratios (IRT), 1: Saline, 2: free DOX, 3: BDOX-CCS, 4: β-Lapachone/BDOX-NCS, 5: β-Lapachone/BDOX-CCS, 6: US + β-Lapachone/BDOX-CCS. (C) Body weight changes over time. (D) Survival rates. (E) Representative photographs of mice treated with different formulations. Tumors are represented by circles in red. Data are means ± SD; **p < 0.01.

