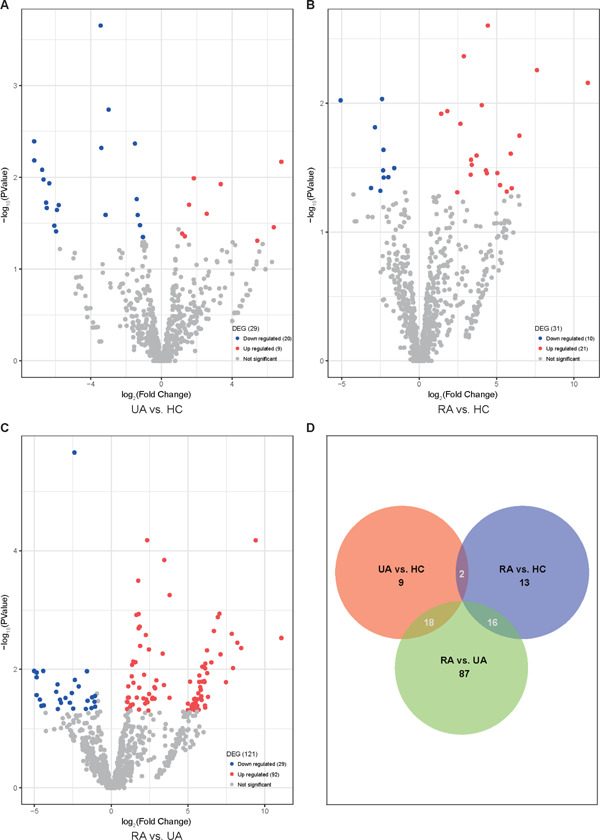
Fig. 3.

NGS analysis of plasma exosomal miRNAs profiles in UA or RA, and HC
A–C Volcano plot showing significantly up-regulated and down-regulated miRNAs among the groups (each point represents a single miRNA). (D) Venn diagram showing the number of differentially expressed miRNAs as compared between groups.
