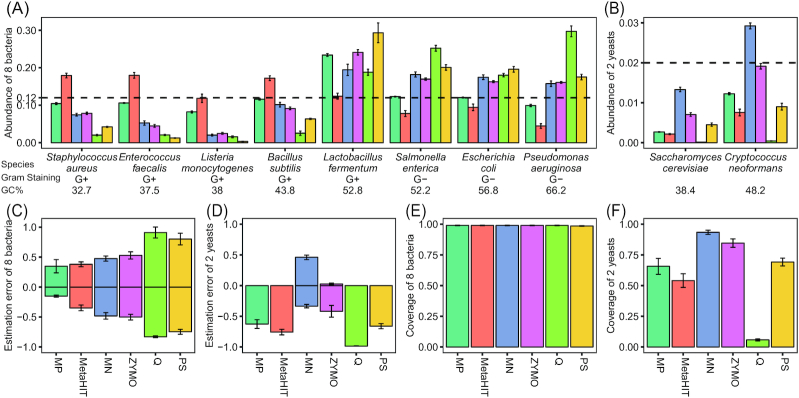
Figure 2:
Performance of the 6 different DNA extraction protocols on an MMC. A, B, Bar plot showing the mean observed relative abundances of 8 bacteria (A) and 2 yeasts (B) using the 6 extraction protocols. C, D, Estimation error (EE) of 8 bacteria (C) and 2 yeasts (D) in all technical replicates for each protocol. E, F, Genome coverage of 8 bacteria (E) and 2 yeasts (F) using the 6 extraction protocols. Genome coverage is calculated as the proportion of the genome reference covered by ≥1 read. The error bars show standard error of the mean in all panels.

