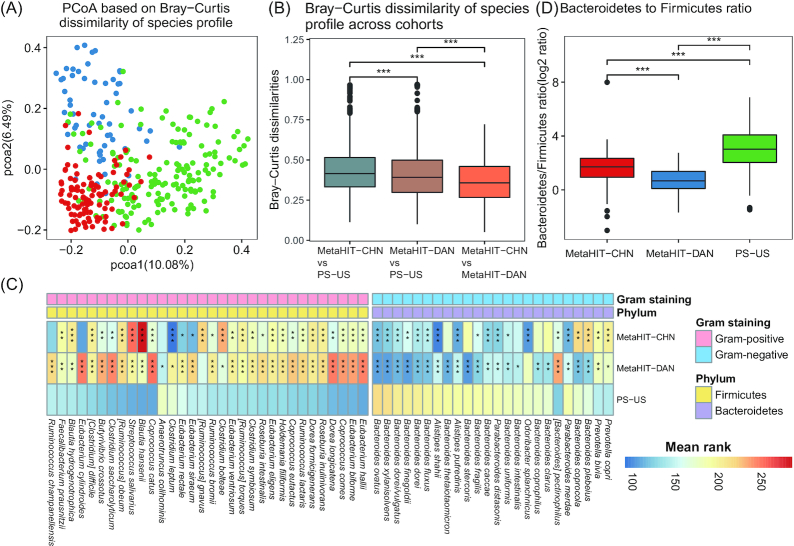
Figure 5:
Links between country-specific gut microbial signatures and the corresponding fecal DNA extraction protocols. A, Principal coordinate analysis (PCoA) based on species-level Bray-Curtis dissimilarities between the 3 cohorts. Red, Chinese adults (protocol MetaHIT); blue, Danish adults (protocol MetaHIT); green, US adults (protocol PS). B, Comparison of Bray-Curtis dissimilarities at the species level between the 3 cohorts. Grey, Chinese vs US adults; brown, Danish vs US adults; orange, Chinese vs Danish adults. C, Heat map showing the significantly differed gram-negative species from Bacteroidetes, and gram-positive species from Firmicutes between Chinese, Danish, and US adults. Color key indicates the mean rank of relative abundance of each species between comparisons in the Kruskal-Wallis test. D, Bacteroidetes to Firmicutes ratio (B/F ratio) between Chinese, Danish, and US adults. Y-axis indicates log2-transformed values of the B/F ratio. For B–-D, pairwise comparisons using the Dunn test were performed after the Kruskal-Wallis test. *BH-adjusted Dunn P < 0.05; **BH-adjusted Dunn P < 0.01; ***BH-adjusted Dunn P < 0.001.

