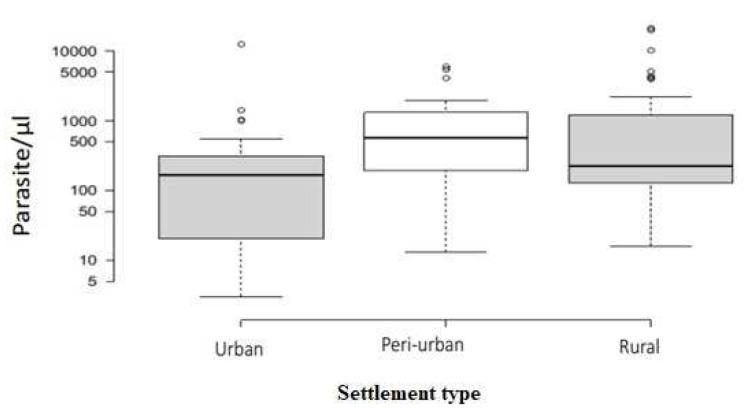
Figure 1. Parasite density across the three types of settlements.
Centre lines show the median counts; box limits indicate the 25th and 75th percentiles as determined by R; whiskers extend 1.5 times the interquartile range from the 25th and 75th percentiles. Widths of boxes are proportional to square-roots of the number of observations, Urban=24, Peri-urban=26 and Rural=43 sample points. The Y-axis shows the estimated number of parasites per microlitre in blood in logarithmic scale. The results were considered significant if p ≤ 0.05.

