Fig. 2.
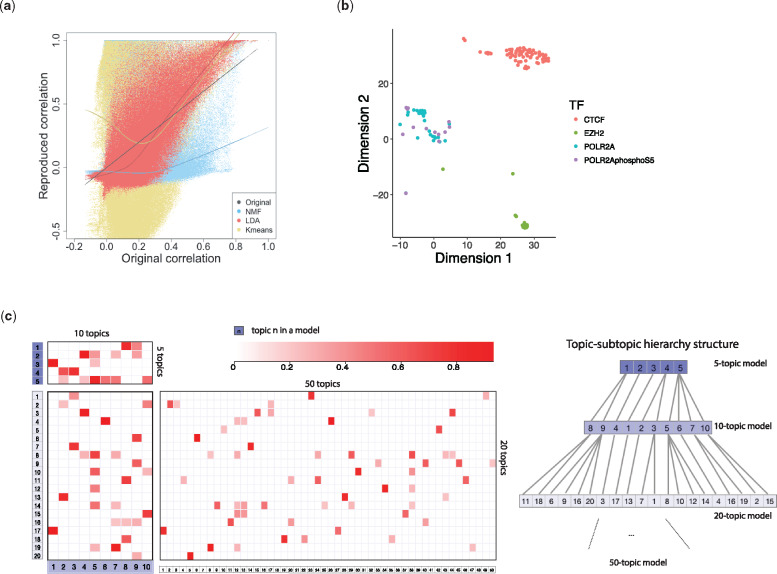
Tuning and performance evaluation of the LDA model. (a) Reproduced pairwise correlations after applying three-dimensionality reduction methods plotted against original correlations. (b) T-SNE embedding of topic weights (50 topic model) for data samples on CTCF, EZH2, POL2A and POL2AphosphoS5. (c) Left: Correlation between topic compositions identified by LDA models with different topic numbers (5, 10, 20, 50). Right: Hierarchical structure of topics inferred from topic correlations (topic correlation is ignored if it has value <0.4 and is not the maximum in its column)

